Central American vs Croatian Master's Degree
COMPARE
Central American
Croatian
Master's Degree
Master's Degree Comparison
Central Americans
Croatians
12.2%
MASTER'S DEGREE
0.3/ 100
METRIC RATING
269th/ 347
METRIC RANK
16.4%
MASTER'S DEGREE
95.6/ 100
METRIC RATING
123rd/ 347
METRIC RANK
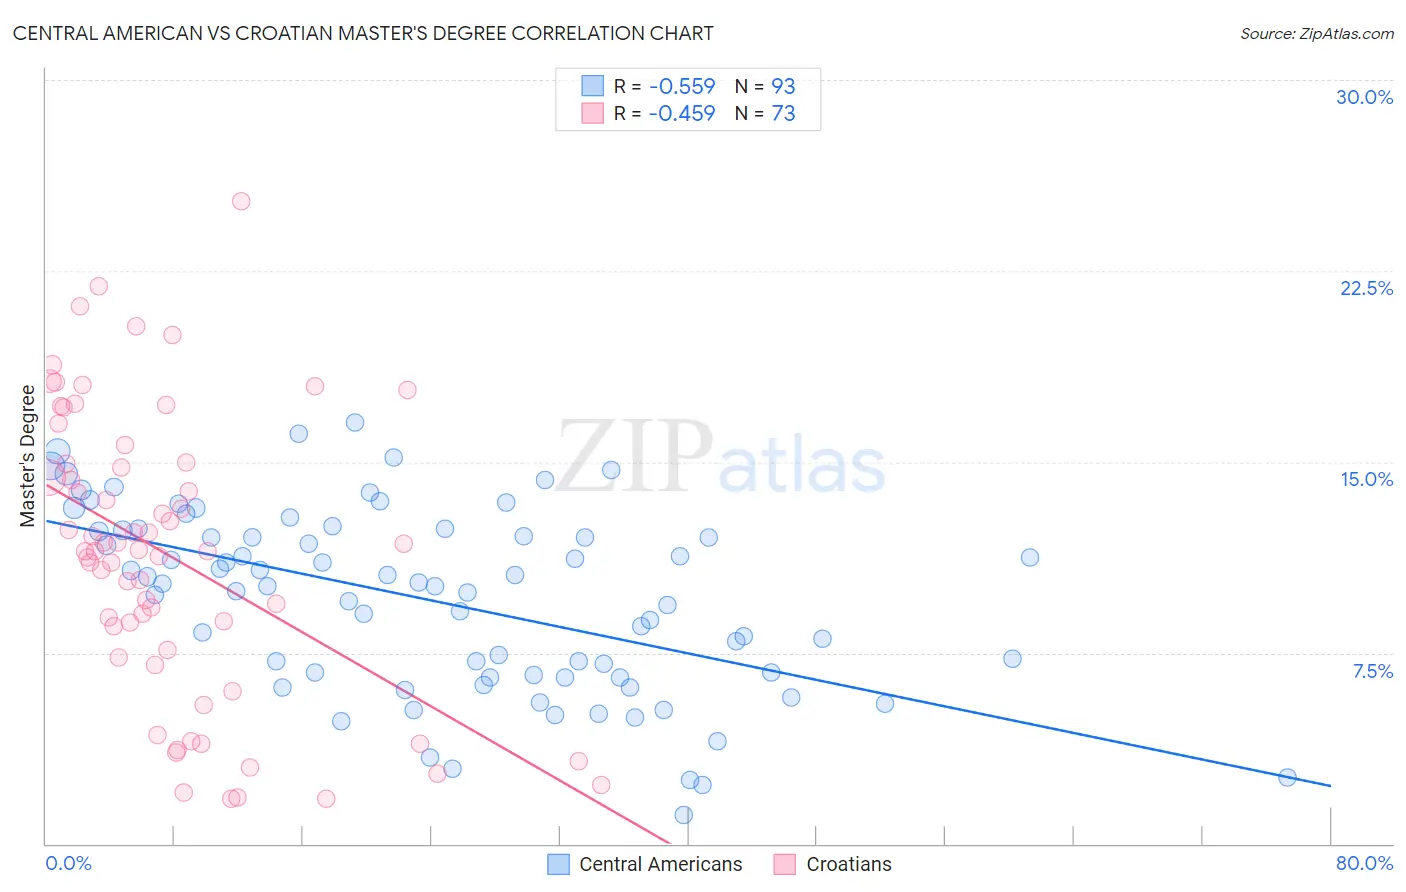
Central American vs Croatian Master's Degree Correlation Chart
The statistical analysis conducted on geographies consisting of 504,206,003 people shows a substantial negative correlation between the proportion of Central Americans and percentage of population with at least master's degree education in the United States with a correlation coefficient (R) of -0.559 and weighted average of 12.2%. Similarly, the statistical analysis conducted on geographies consisting of 375,633,204 people shows a moderate negative correlation between the proportion of Croatians and percentage of population with at least master's degree education in the United States with a correlation coefficient (R) of -0.459 and weighted average of 16.4%, a difference of 34.4%.
Master's Degree Correlation Summary
| Measurement | Central American | Croatian |
| Minimum | 1.1% | 1.8% |
| Maximum | 16.6% | 25.2% |
| Range | 15.4% | 23.5% |
| Mean | 9.5% | 11.3% |
| Median | 10.1% | 11.5% |
| Interquartile 25% (IQ1) | 6.6% | 7.5% |
| Interquartile 75% (IQ3) | 12.3% | 15.0% |
| Interquartile Range (IQR) | 5.7% | 7.5% |
| Standard Deviation (Sample) | 3.6% | 5.6% |
| Standard Deviation (Population) | 3.6% | 5.5% |
Similar Demographics by Master's Degree
Demographics Similar to Central Americans by Master's Degree
In terms of master's degree, the demographic groups most similar to Central Americans are Salvadoran (12.2%, a difference of 0.13%), Native Hawaiian (12.3%, a difference of 0.65%), Haitian (12.1%, a difference of 0.72%), Comanche (12.1%, a difference of 0.78%), and Blackfeet (12.1%, a difference of 0.87%).
| Demographics | Rating | Rank | Master's Degree |
| Nicaraguans | 0.6 /100 | #262 | Tragic 12.5% |
| Central American Indians | 0.5 /100 | #263 | Tragic 12.4% |
| Belizeans | 0.5 /100 | #264 | Tragic 12.4% |
| Immigrants | Fiji | 0.5 /100 | #265 | Tragic 12.4% |
| Bahamians | 0.5 /100 | #266 | Tragic 12.4% |
| Americans | 0.4 /100 | #267 | Tragic 12.3% |
| Native Hawaiians | 0.4 /100 | #268 | Tragic 12.3% |
| Central Americans | 0.3 /100 | #269 | Tragic 12.2% |
| Salvadorans | 0.3 /100 | #270 | Tragic 12.2% |
| Haitians | 0.3 /100 | #271 | Tragic 12.1% |
| Comanche | 0.3 /100 | #272 | Tragic 12.1% |
| Blackfeet | 0.3 /100 | #273 | Tragic 12.1% |
| Cape Verdeans | 0.3 /100 | #274 | Tragic 12.1% |
| Cubans | 0.3 /100 | #275 | Tragic 12.1% |
| Blacks/African Americans | 0.3 /100 | #276 | Tragic 12.1% |
Demographics Similar to Croatians by Master's Degree
In terms of master's degree, the demographic groups most similar to Croatians are British (16.4%, a difference of 0.010%), Immigrants from Eritrea (16.4%, a difference of 0.070%), Italian (16.4%, a difference of 0.14%), Immigrants from Eastern Africa (16.3%, a difference of 0.26%), and Afghan (16.5%, a difference of 0.44%).
| Demographics | Rating | Rank | Master's Degree |
| Immigrants | Southern Europe | 97.2 /100 | #116 | Exceptional 16.6% |
| Immigrants | Moldova | 97.2 /100 | #117 | Exceptional 16.6% |
| Brazilians | 96.8 /100 | #118 | Exceptional 16.5% |
| Jordanians | 96.5 /100 | #119 | Exceptional 16.5% |
| Lebanese | 96.4 /100 | #120 | Exceptional 16.5% |
| Afghans | 96.2 /100 | #121 | Exceptional 16.5% |
| British | 95.6 /100 | #122 | Exceptional 16.4% |
| Croatians | 95.6 /100 | #123 | Exceptional 16.4% |
| Immigrants | Eritrea | 95.5 /100 | #124 | Exceptional 16.4% |
| Italians | 95.4 /100 | #125 | Exceptional 16.4% |
| Immigrants | Eastern Africa | 95.2 /100 | #126 | Exceptional 16.3% |
| Palestinians | 94.8 /100 | #127 | Exceptional 16.3% |
| Immigrants | Sierra Leone | 94.7 /100 | #128 | Exceptional 16.3% |
| Immigrants | Syria | 93.3 /100 | #129 | Exceptional 16.2% |
| Immigrants | Jordan | 92.7 /100 | #130 | Exceptional 16.1% |