Central American vs Bulgarian Master's Degree
COMPARE
Central American
Bulgarian
Master's Degree
Master's Degree Comparison
Central Americans
Bulgarians
12.2%
MASTER'S DEGREE
0.3/ 100
METRIC RATING
269th/ 347
METRIC RANK
18.8%
MASTER'S DEGREE
100.0/ 100
METRIC RATING
50th/ 347
METRIC RANK
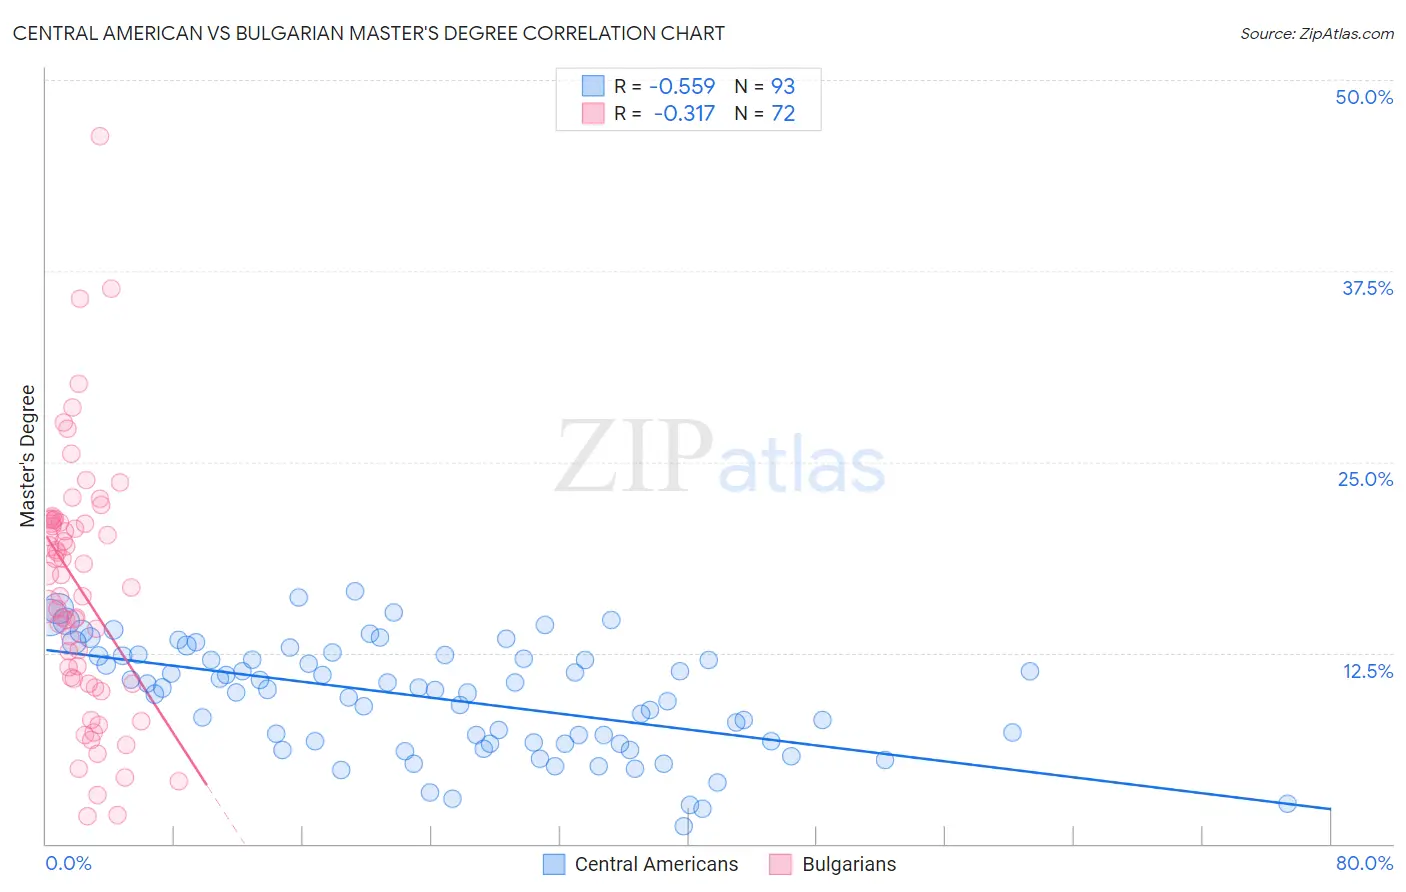
Central American vs Bulgarian Master's Degree Correlation Chart
The statistical analysis conducted on geographies consisting of 504,206,003 people shows a substantial negative correlation between the proportion of Central Americans and percentage of population with at least master's degree education in the United States with a correlation coefficient (R) of -0.559 and weighted average of 12.2%. Similarly, the statistical analysis conducted on geographies consisting of 205,591,570 people shows a mild negative correlation between the proportion of Bulgarians and percentage of population with at least master's degree education in the United States with a correlation coefficient (R) of -0.317 and weighted average of 18.8%, a difference of 53.8%.
Master's Degree Correlation Summary
| Measurement | Central American | Bulgarian |
| Minimum | 1.1% | 1.8% |
| Maximum | 16.6% | 46.3% |
| Range | 15.4% | 44.5% |
| Mean | 9.5% | 16.7% |
| Median | 10.1% | 17.2% |
| Interquartile 25% (IQ1) | 6.6% | 10.6% |
| Interquartile 75% (IQ3) | 12.3% | 21.1% |
| Interquartile Range (IQR) | 5.7% | 10.4% |
| Standard Deviation (Sample) | 3.6% | 8.3% |
| Standard Deviation (Population) | 3.6% | 8.2% |
Similar Demographics by Master's Degree
Demographics Similar to Central Americans by Master's Degree
In terms of master's degree, the demographic groups most similar to Central Americans are Salvadoran (12.2%, a difference of 0.13%), Native Hawaiian (12.3%, a difference of 0.65%), Haitian (12.1%, a difference of 0.72%), Comanche (12.1%, a difference of 0.78%), and Blackfeet (12.1%, a difference of 0.87%).
| Demographics | Rating | Rank | Master's Degree |
| Nicaraguans | 0.6 /100 | #262 | Tragic 12.5% |
| Central American Indians | 0.5 /100 | #263 | Tragic 12.4% |
| Belizeans | 0.5 /100 | #264 | Tragic 12.4% |
| Immigrants | Fiji | 0.5 /100 | #265 | Tragic 12.4% |
| Bahamians | 0.5 /100 | #266 | Tragic 12.4% |
| Americans | 0.4 /100 | #267 | Tragic 12.3% |
| Native Hawaiians | 0.4 /100 | #268 | Tragic 12.3% |
| Central Americans | 0.3 /100 | #269 | Tragic 12.2% |
| Salvadorans | 0.3 /100 | #270 | Tragic 12.2% |
| Haitians | 0.3 /100 | #271 | Tragic 12.1% |
| Comanche | 0.3 /100 | #272 | Tragic 12.1% |
| Blackfeet | 0.3 /100 | #273 | Tragic 12.1% |
| Cape Verdeans | 0.3 /100 | #274 | Tragic 12.1% |
| Cubans | 0.3 /100 | #275 | Tragic 12.1% |
| Blacks/African Americans | 0.3 /100 | #276 | Tragic 12.1% |
Demographics Similar to Bulgarians by Master's Degree
In terms of master's degree, the demographic groups most similar to Bulgarians are Immigrants from South Africa (18.8%, a difference of 0.010%), Estonian (18.8%, a difference of 0.19%), Paraguayan (18.8%, a difference of 0.28%), Immigrants from Austria (18.8%, a difference of 0.34%), and Immigrants from Norway (18.8%, a difference of 0.35%).
| Demographics | Rating | Rank | Master's Degree |
| Immigrants | Greece | 100.0 /100 | #43 | Exceptional 19.0% |
| Immigrants | Malaysia | 100.0 /100 | #44 | Exceptional 18.9% |
| Immigrants | Belarus | 100.0 /100 | #45 | Exceptional 18.9% |
| Immigrants | Norway | 100.0 /100 | #46 | Exceptional 18.8% |
| Immigrants | Austria | 100.0 /100 | #47 | Exceptional 18.8% |
| Paraguayans | 100.0 /100 | #48 | Exceptional 18.8% |
| Estonians | 100.0 /100 | #49 | Exceptional 18.8% |
| Bulgarians | 100.0 /100 | #50 | Exceptional 18.8% |
| Immigrants | South Africa | 100.0 /100 | #51 | Exceptional 18.8% |
| Immigrants | Kuwait | 100.0 /100 | #52 | Exceptional 18.6% |
| Immigrants | Czechoslovakia | 99.9 /100 | #53 | Exceptional 18.5% |
| Immigrants | Lithuania | 99.9 /100 | #54 | Exceptional 18.5% |
| Immigrants | Serbia | 99.9 /100 | #55 | Exceptional 18.5% |
| Asians | 99.9 /100 | #56 | Exceptional 18.4% |
| Immigrants | Asia | 99.9 /100 | #57 | Exceptional 18.4% |