Immigrants from Thailand vs Immigrants from the Azores Master's Degree
COMPARE
Immigrants from Thailand
Immigrants from the Azores
Master's Degree
Master's Degree Comparison
Immigrants from Thailand
Immigrants from the Azores
14.2%
MASTER'S DEGREE
17.0/ 100
METRIC RATING
213th/ 347
METRIC RANK
10.2%
MASTER'S DEGREE
0.0/ 100
METRIC RATING
332nd/ 347
METRIC RANK
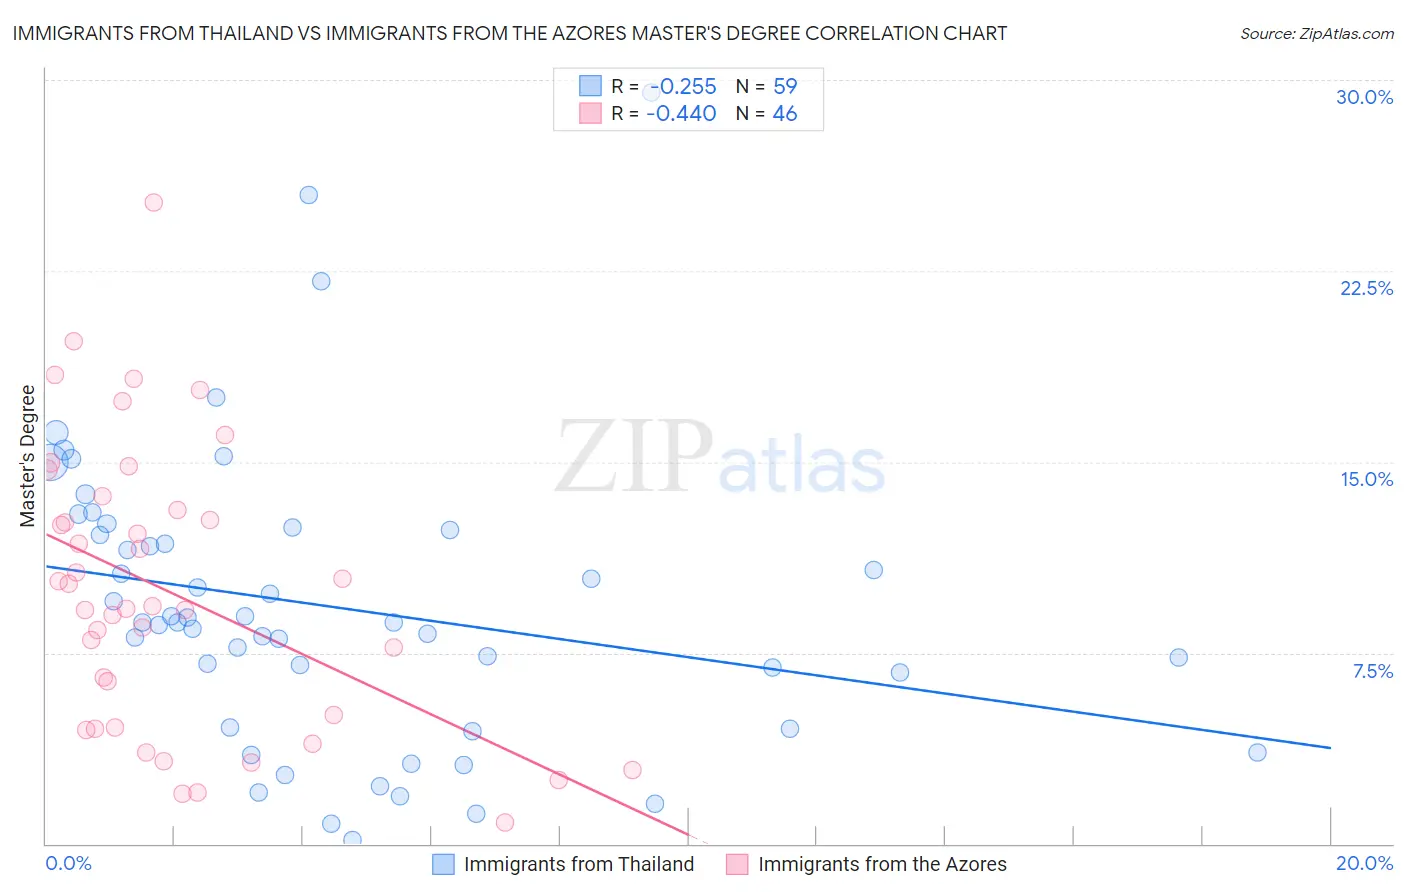
Immigrants from Thailand vs Immigrants from the Azores Master's Degree Correlation Chart
The statistical analysis conducted on geographies consisting of 316,948,216 people shows a weak negative correlation between the proportion of Immigrants from Thailand and percentage of population with at least master's degree education in the United States with a correlation coefficient (R) of -0.255 and weighted average of 14.2%. Similarly, the statistical analysis conducted on geographies consisting of 46,256,023 people shows a moderate negative correlation between the proportion of Immigrants from the Azores and percentage of population with at least master's degree education in the United States with a correlation coefficient (R) of -0.440 and weighted average of 10.2%, a difference of 38.5%.
Master's Degree Correlation Summary
| Measurement | Immigrants from Thailand | Immigrants from the Azores |
| Minimum | 0.16% | 0.81% |
| Maximum | 29.5% | 25.2% |
| Range | 29.4% | 24.4% |
| Mean | 9.3% | 9.9% |
| Median | 8.7% | 9.3% |
| Interquartile 25% (IQ1) | 4.5% | 4.6% |
| Interquartile 75% (IQ3) | 12.3% | 13.1% |
| Interquartile Range (IQR) | 7.8% | 8.5% |
| Standard Deviation (Sample) | 5.8% | 5.6% |
| Standard Deviation (Population) | 5.7% | 5.5% |
Similar Demographics by Master's Degree
Demographics Similar to Immigrants from Thailand by Master's Degree
In terms of master's degree, the demographic groups most similar to Immigrants from Thailand are Finnish (14.2%, a difference of 0.010%), Spanish (14.2%, a difference of 0.19%), Immigrants from Vietnam (14.1%, a difference of 0.22%), Somali (14.2%, a difference of 0.24%), and Immigrants from Somalia (14.1%, a difference of 0.29%).
| Demographics | Rating | Rank | Master's Degree |
| Scandinavians | 23.3 /100 | #206 | Fair 14.4% |
| Immigrants | Bosnia and Herzegovina | 22.0 /100 | #207 | Fair 14.3% |
| Immigrants | Barbados | 20.5 /100 | #208 | Fair 14.3% |
| Immigrants | Panama | 20.0 /100 | #209 | Fair 14.3% |
| Sub-Saharan Africans | 19.4 /100 | #210 | Poor 14.2% |
| Somalis | 18.0 /100 | #211 | Poor 14.2% |
| Spanish | 17.8 /100 | #212 | Poor 14.2% |
| Immigrants | Thailand | 17.0 /100 | #213 | Poor 14.2% |
| Finns | 16.9 /100 | #214 | Poor 14.2% |
| Immigrants | Vietnam | 16.1 /100 | #215 | Poor 14.1% |
| Immigrants | Somalia | 15.8 /100 | #216 | Poor 14.1% |
| Immigrants | Trinidad and Tobago | 15.8 /100 | #217 | Poor 14.1% |
| French Canadians | 14.9 /100 | #218 | Poor 14.1% |
| Norwegians | 13.6 /100 | #219 | Poor 14.0% |
| Germans | 13.1 /100 | #220 | Poor 14.0% |
Demographics Similar to Immigrants from the Azores by Master's Degree
In terms of master's degree, the demographic groups most similar to Immigrants from the Azores are Menominee (10.2%, a difference of 0.37%), Pueblo (10.3%, a difference of 0.46%), Fijian (10.3%, a difference of 0.63%), Arapaho (10.0%, a difference of 2.3%), and Nepalese (10.5%, a difference of 2.4%).
| Demographics | Rating | Rank | Master's Degree |
| Inupiat | 0.0 /100 | #325 | Tragic 10.5% |
| Creek | 0.0 /100 | #326 | Tragic 10.5% |
| Paiute | 0.0 /100 | #327 | Tragic 10.5% |
| Bangladeshis | 0.0 /100 | #328 | Tragic 10.5% |
| Nepalese | 0.0 /100 | #329 | Tragic 10.5% |
| Fijians | 0.0 /100 | #330 | Tragic 10.3% |
| Pueblo | 0.0 /100 | #331 | Tragic 10.3% |
| Immigrants | Azores | 0.0 /100 | #332 | Tragic 10.2% |
| Menominee | 0.0 /100 | #333 | Tragic 10.2% |
| Arapaho | 0.0 /100 | #334 | Tragic 10.0% |
| Immigrants | Central America | 0.0 /100 | #335 | Tragic 10.0% |
| Natives/Alaskans | 0.0 /100 | #336 | Tragic 9.9% |
| Mexicans | 0.0 /100 | #337 | Tragic 9.7% |
| Tohono O'odham | 0.0 /100 | #338 | Tragic 9.7% |
| Spanish American Indians | 0.0 /100 | #339 | Tragic 9.6% |