Syrian vs Immigrants from the Azores Master's Degree
COMPARE
Syrian
Immigrants from the Azores
Master's Degree
Master's Degree Comparison
Syrians
Immigrants from the Azores
16.8%
MASTER'S DEGREE
98.3/ 100
METRIC RATING
105th/ 347
METRIC RANK
10.2%
MASTER'S DEGREE
0.0/ 100
METRIC RATING
332nd/ 347
METRIC RANK
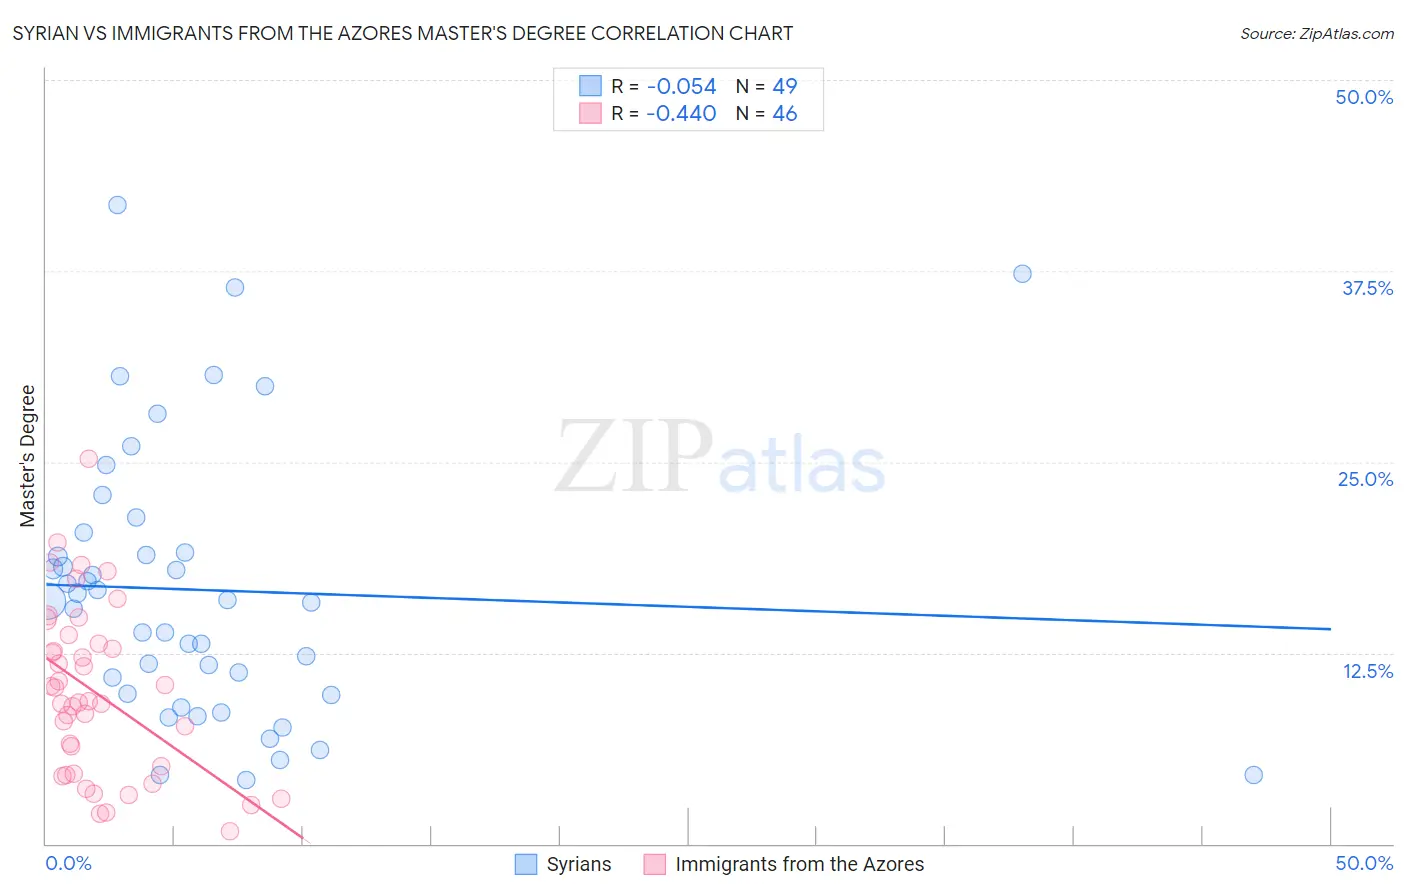
Syrian vs Immigrants from the Azores Master's Degree Correlation Chart
The statistical analysis conducted on geographies consisting of 266,236,356 people shows a slight negative correlation between the proportion of Syrians and percentage of population with at least master's degree education in the United States with a correlation coefficient (R) of -0.054 and weighted average of 16.8%. Similarly, the statistical analysis conducted on geographies consisting of 46,256,023 people shows a moderate negative correlation between the proportion of Immigrants from the Azores and percentage of population with at least master's degree education in the United States with a correlation coefficient (R) of -0.440 and weighted average of 10.2%, a difference of 64.7%.
Master's Degree Correlation Summary
| Measurement | Syrian | Immigrants from the Azores |
| Minimum | 4.2% | 0.81% |
| Maximum | 41.8% | 25.2% |
| Range | 37.6% | 24.4% |
| Mean | 16.6% | 9.9% |
| Median | 15.9% | 9.3% |
| Interquartile 25% (IQ1) | 9.8% | 4.6% |
| Interquartile 75% (IQ3) | 19.7% | 13.1% |
| Interquartile Range (IQR) | 9.9% | 8.5% |
| Standard Deviation (Sample) | 8.9% | 5.6% |
| Standard Deviation (Population) | 8.8% | 5.5% |
Similar Demographics by Master's Degree
Demographics Similar to Syrians by Master's Degree
In terms of master's degree, the demographic groups most similar to Syrians are Ukrainian (16.9%, a difference of 0.10%), Alsatian (16.9%, a difference of 0.22%), Immigrants from Albania (16.8%, a difference of 0.28%), Armenian (16.8%, a difference of 0.37%), and Sierra Leonean (16.8%, a difference of 0.40%).
| Demographics | Rating | Rank | Master's Degree |
| Immigrants | Ukraine | 98.8 /100 | #98 | Exceptional 17.0% |
| Laotians | 98.8 /100 | #99 | Exceptional 17.0% |
| Albanians | 98.7 /100 | #100 | Exceptional 17.0% |
| Immigrants | Nepal | 98.6 /100 | #101 | Exceptional 17.0% |
| Chileans | 98.6 /100 | #102 | Exceptional 16.9% |
| Alsatians | 98.4 /100 | #103 | Exceptional 16.9% |
| Ukrainians | 98.3 /100 | #104 | Exceptional 16.9% |
| Syrians | 98.3 /100 | #105 | Exceptional 16.8% |
| Immigrants | Albania | 98.1 /100 | #106 | Exceptional 16.8% |
| Armenians | 98.0 /100 | #107 | Exceptional 16.8% |
| Sierra Leoneans | 98.0 /100 | #108 | Exceptional 16.8% |
| Moroccans | 98.0 /100 | #109 | Exceptional 16.8% |
| Immigrants | Chile | 98.0 /100 | #110 | Exceptional 16.8% |
| Austrians | 97.8 /100 | #111 | Exceptional 16.7% |
| Macedonians | 97.7 /100 | #112 | Exceptional 16.7% |
Demographics Similar to Immigrants from the Azores by Master's Degree
In terms of master's degree, the demographic groups most similar to Immigrants from the Azores are Menominee (10.2%, a difference of 0.37%), Pueblo (10.3%, a difference of 0.46%), Fijian (10.3%, a difference of 0.63%), Arapaho (10.0%, a difference of 2.3%), and Nepalese (10.5%, a difference of 2.4%).
| Demographics | Rating | Rank | Master's Degree |
| Inupiat | 0.0 /100 | #325 | Tragic 10.5% |
| Creek | 0.0 /100 | #326 | Tragic 10.5% |
| Paiute | 0.0 /100 | #327 | Tragic 10.5% |
| Bangladeshis | 0.0 /100 | #328 | Tragic 10.5% |
| Nepalese | 0.0 /100 | #329 | Tragic 10.5% |
| Fijians | 0.0 /100 | #330 | Tragic 10.3% |
| Pueblo | 0.0 /100 | #331 | Tragic 10.3% |
| Immigrants | Azores | 0.0 /100 | #332 | Tragic 10.2% |
| Menominee | 0.0 /100 | #333 | Tragic 10.2% |
| Arapaho | 0.0 /100 | #334 | Tragic 10.0% |
| Immigrants | Central America | 0.0 /100 | #335 | Tragic 10.0% |
| Natives/Alaskans | 0.0 /100 | #336 | Tragic 9.9% |
| Mexicans | 0.0 /100 | #337 | Tragic 9.7% |
| Tohono O'odham | 0.0 /100 | #338 | Tragic 9.7% |
| Spanish American Indians | 0.0 /100 | #339 | Tragic 9.6% |