Salvadoran vs Immigrants from South America No Schooling Completed
COMPARE
Salvadoran
Immigrants from South America
No Schooling Completed
No Schooling Completed Comparison
Salvadorans
Immigrants from South America
3.7%
NO SCHOOLING COMPLETED
0.0/ 100
METRIC RATING
343rd/ 347
METRIC RANK
2.5%
NO SCHOOLING COMPLETED
0.6/ 100
METRIC RATING
257th/ 347
METRIC RANK
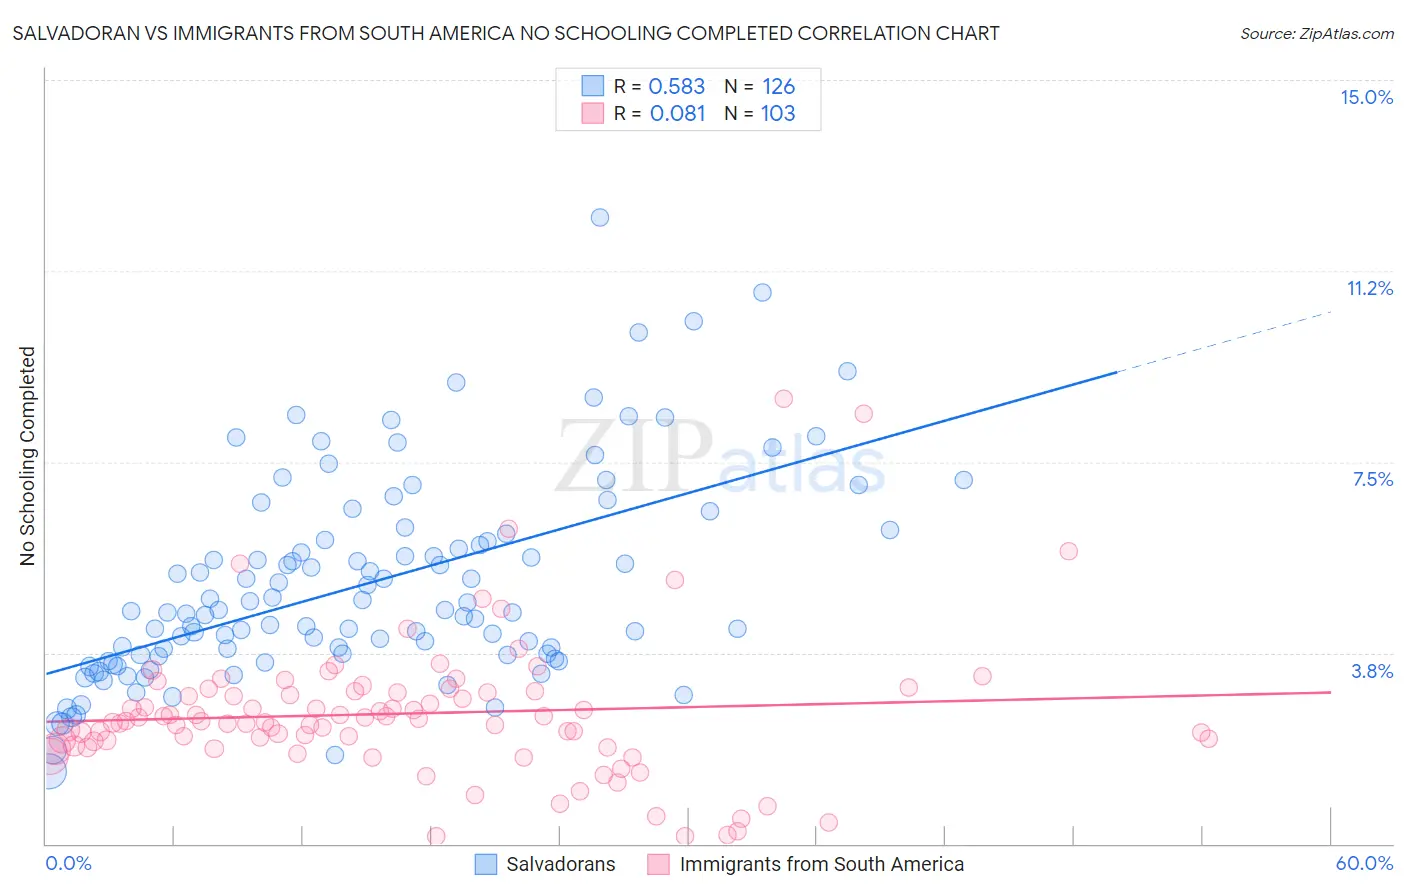
Salvadoran vs Immigrants from South America No Schooling Completed Correlation Chart
The statistical analysis conducted on geographies consisting of 395,950,136 people shows a substantial positive correlation between the proportion of Salvadorans and percentage of population with no schooling in the United States with a correlation coefficient (R) of 0.583 and weighted average of 3.7%. Similarly, the statistical analysis conducted on geographies consisting of 479,047,016 people shows a slight positive correlation between the proportion of Immigrants from South America and percentage of population with no schooling in the United States with a correlation coefficient (R) of 0.081 and weighted average of 2.5%, a difference of 52.7%.
No Schooling Completed Correlation Summary
| Measurement | Salvadoran | Immigrants from South America |
| Minimum | 1.4% | 0.14% |
| Maximum | 12.3% | 8.7% |
| Range | 10.9% | 8.6% |
| Mean | 5.1% | 2.6% |
| Median | 4.6% | 2.4% |
| Interquartile 25% (IQ1) | 3.7% | 1.9% |
| Interquartile 75% (IQ3) | 6.0% | 3.0% |
| Interquartile Range (IQR) | 2.3% | 1.1% |
| Standard Deviation (Sample) | 2.0% | 1.4% |
| Standard Deviation (Population) | 2.0% | 1.4% |
Similar Demographics by No Schooling Completed
Demographics Similar to Salvadorans by No Schooling Completed
In terms of no schooling completed, the demographic groups most similar to Salvadorans are Nepalese (3.8%, a difference of 1.7%), Immigrants from Mexico (3.6%, a difference of 2.8%), Immigrants from El Salvador (3.9%, a difference of 3.5%), Immigrants from Central America (3.6%, a difference of 3.6%), and Immigrants from Guatemala (3.6%, a difference of 4.7%).
| Demographics | Rating | Rank | No Schooling Completed |
| Immigrants | Dominican Republic | 0.0 /100 | #333 | Tragic 3.4% |
| Guatemalans | 0.0 /100 | #334 | Tragic 3.5% |
| Immigrants | Cambodia | 0.0 /100 | #335 | Tragic 3.5% |
| Immigrants | Fiji | 0.0 /100 | #336 | Tragic 3.5% |
| Immigrants | Cabo Verde | 0.0 /100 | #337 | Tragic 3.5% |
| Bangladeshis | 0.0 /100 | #338 | Tragic 3.5% |
| Yakama | 0.0 /100 | #339 | Tragic 3.6% |
| Immigrants | Guatemala | 0.0 /100 | #340 | Tragic 3.6% |
| Immigrants | Central America | 0.0 /100 | #341 | Tragic 3.6% |
| Immigrants | Mexico | 0.0 /100 | #342 | Tragic 3.6% |
| Salvadorans | 0.0 /100 | #343 | Tragic 3.7% |
| Nepalese | 0.0 /100 | #344 | Tragic 3.8% |
| Immigrants | El Salvador | 0.0 /100 | #345 | Tragic 3.9% |
| Immigrants | Yemen | 0.0 /100 | #346 | Tragic 4.1% |
| Spanish American Indians | 0.0 /100 | #347 | Tragic 4.2% |
Demographics Similar to Immigrants from South America by No Schooling Completed
In terms of no schooling completed, the demographic groups most similar to Immigrants from South America are Assyrian/Chaldean/Syriac (2.5%, a difference of 0.030%), Immigrants from Jamaica (2.5%, a difference of 0.090%), Immigrants from Ethiopia (2.5%, a difference of 0.14%), Armenian (2.5%, a difference of 0.26%), and Immigrants from Sierra Leone (2.5%, a difference of 0.61%).
| Demographics | Rating | Rank | No Schooling Completed |
| Immigrants | Middle Africa | 1.1 /100 | #250 | Tragic 2.4% |
| Immigrants | Africa | 1.1 /100 | #251 | Tragic 2.4% |
| Immigrants | Colombia | 1.0 /100 | #252 | Tragic 2.4% |
| Immigrants | Asia | 0.9 /100 | #253 | Tragic 2.4% |
| Immigrants | Eastern Africa | 0.9 /100 | #254 | Tragic 2.4% |
| Ethiopians | 0.8 /100 | #255 | Tragic 2.4% |
| Yaqui | 0.8 /100 | #256 | Tragic 2.4% |
| Immigrants | South America | 0.6 /100 | #257 | Tragic 2.5% |
| Assyrians/Chaldeans/Syriacs | 0.6 /100 | #258 | Tragic 2.5% |
| Immigrants | Jamaica | 0.6 /100 | #259 | Tragic 2.5% |
| Immigrants | Ethiopia | 0.6 /100 | #260 | Tragic 2.5% |
| Armenians | 0.5 /100 | #261 | Tragic 2.5% |
| Immigrants | Sierra Leone | 0.5 /100 | #262 | Tragic 2.5% |
| Immigrants | Liberia | 0.4 /100 | #263 | Tragic 2.5% |
| Indians (Asian) | 0.4 /100 | #264 | Tragic 2.5% |