Immigrants from Poland vs Immigrants from South America No Schooling Completed
COMPARE
Immigrants from Poland
Immigrants from South America
No Schooling Completed
No Schooling Completed Comparison
Immigrants from Poland
Immigrants from South America
2.1%
NO SCHOOLING COMPLETED
55.2/ 100
METRIC RATING
171st/ 347
METRIC RANK
2.5%
NO SCHOOLING COMPLETED
0.6/ 100
METRIC RATING
257th/ 347
METRIC RANK
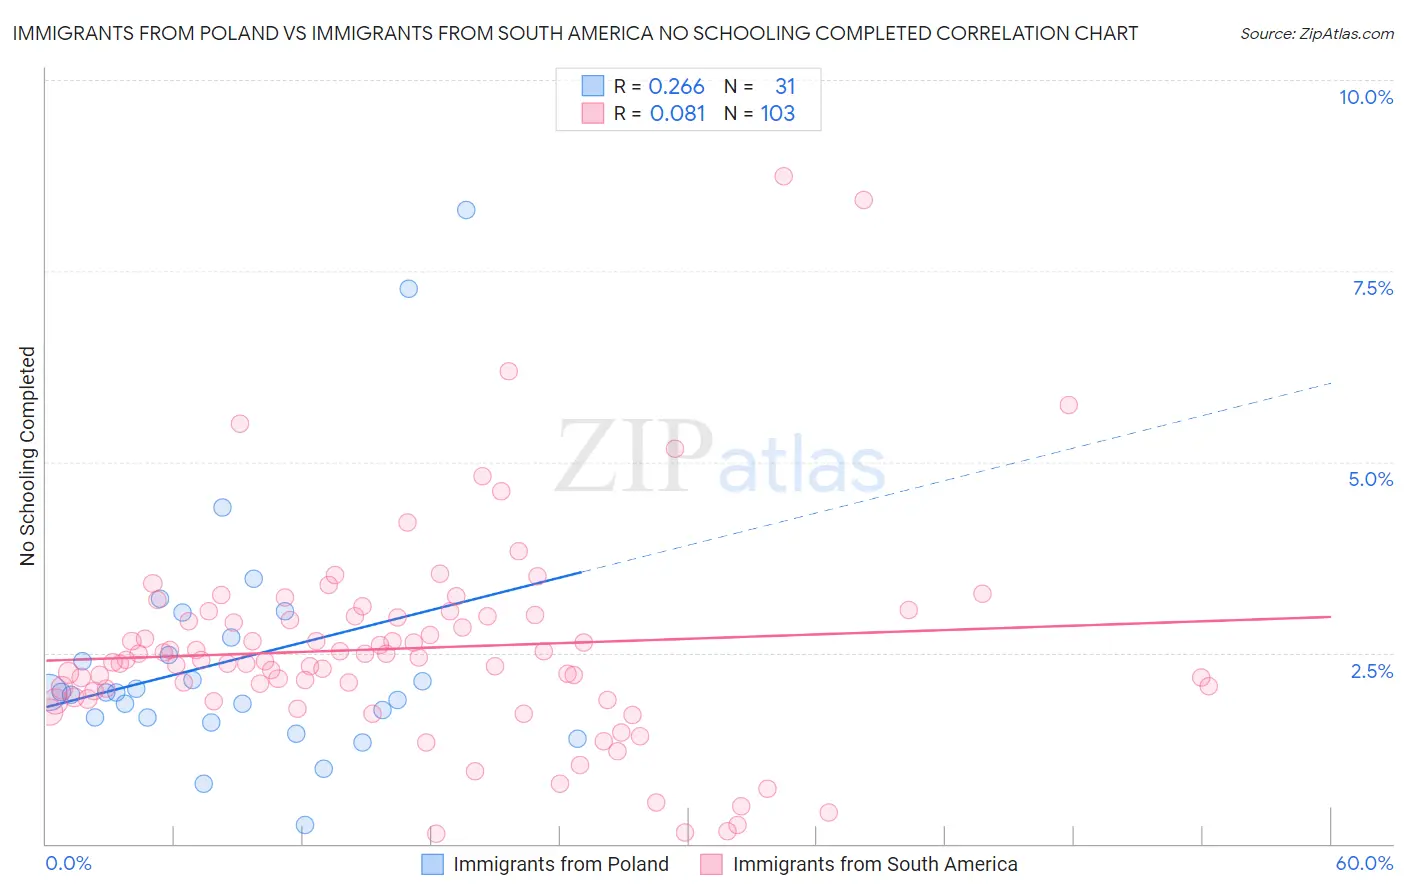
Immigrants from Poland vs Immigrants from South America No Schooling Completed Correlation Chart
The statistical analysis conducted on geographies consisting of 302,129,066 people shows a weak positive correlation between the proportion of Immigrants from Poland and percentage of population with no schooling in the United States with a correlation coefficient (R) of 0.266 and weighted average of 2.1%. Similarly, the statistical analysis conducted on geographies consisting of 479,047,016 people shows a slight positive correlation between the proportion of Immigrants from South America and percentage of population with no schooling in the United States with a correlation coefficient (R) of 0.081 and weighted average of 2.5%, a difference of 18.1%.
No Schooling Completed Correlation Summary
| Measurement | Immigrants from Poland | Immigrants from South America |
| Minimum | 0.25% | 0.14% |
| Maximum | 8.3% | 8.7% |
| Range | 8.0% | 8.6% |
| Mean | 2.4% | 2.6% |
| Median | 2.0% | 2.4% |
| Interquartile 25% (IQ1) | 1.6% | 1.9% |
| Interquartile 75% (IQ3) | 2.7% | 3.0% |
| Interquartile Range (IQR) | 1.0% | 1.1% |
| Standard Deviation (Sample) | 1.7% | 1.4% |
| Standard Deviation (Population) | 1.6% | 1.4% |
Similar Demographics by No Schooling Completed
Demographics Similar to Immigrants from Poland by No Schooling Completed
In terms of no schooling completed, the demographic groups most similar to Immigrants from Poland are Argentinean (2.1%, a difference of 0.11%), Apache (2.1%, a difference of 0.20%), Immigrants from Argentina (2.1%, a difference of 0.33%), Immigrants from Belarus (2.1%, a difference of 0.46%), and Cheyenne (2.1%, a difference of 0.47%).
| Demographics | Rating | Rank | No Schooling Completed |
| Comanche | 60.7 /100 | #164 | Good 2.1% |
| Brazilians | 60.2 /100 | #165 | Good 2.1% |
| Dutch West Indians | 59.9 /100 | #166 | Average 2.1% |
| Egyptians | 59.2 /100 | #167 | Average 2.1% |
| Cheyenne | 58.6 /100 | #168 | Average 2.1% |
| Apache | 56.7 /100 | #169 | Average 2.1% |
| Argentineans | 56.0 /100 | #170 | Average 2.1% |
| Immigrants | Poland | 55.2 /100 | #171 | Average 2.1% |
| Immigrants | Argentina | 52.7 /100 | #172 | Average 2.1% |
| Immigrants | Belarus | 51.8 /100 | #173 | Average 2.1% |
| Immigrants | Micronesia | 50.0 /100 | #174 | Average 2.1% |
| Arabs | 46.4 /100 | #175 | Average 2.1% |
| Panamanians | 45.2 /100 | #176 | Average 2.1% |
| Arapaho | 45.0 /100 | #177 | Average 2.1% |
| Pakistanis | 44.7 /100 | #178 | Average 2.1% |
Demographics Similar to Immigrants from South America by No Schooling Completed
In terms of no schooling completed, the demographic groups most similar to Immigrants from South America are Assyrian/Chaldean/Syriac (2.5%, a difference of 0.030%), Immigrants from Jamaica (2.5%, a difference of 0.090%), Immigrants from Ethiopia (2.5%, a difference of 0.14%), Armenian (2.5%, a difference of 0.26%), and Immigrants from Sierra Leone (2.5%, a difference of 0.61%).
| Demographics | Rating | Rank | No Schooling Completed |
| Immigrants | Middle Africa | 1.1 /100 | #250 | Tragic 2.4% |
| Immigrants | Africa | 1.1 /100 | #251 | Tragic 2.4% |
| Immigrants | Colombia | 1.0 /100 | #252 | Tragic 2.4% |
| Immigrants | Asia | 0.9 /100 | #253 | Tragic 2.4% |
| Immigrants | Eastern Africa | 0.9 /100 | #254 | Tragic 2.4% |
| Ethiopians | 0.8 /100 | #255 | Tragic 2.4% |
| Yaqui | 0.8 /100 | #256 | Tragic 2.4% |
| Immigrants | South America | 0.6 /100 | #257 | Tragic 2.5% |
| Assyrians/Chaldeans/Syriacs | 0.6 /100 | #258 | Tragic 2.5% |
| Immigrants | Jamaica | 0.6 /100 | #259 | Tragic 2.5% |
| Immigrants | Ethiopia | 0.6 /100 | #260 | Tragic 2.5% |
| Armenians | 0.5 /100 | #261 | Tragic 2.5% |
| Immigrants | Sierra Leone | 0.5 /100 | #262 | Tragic 2.5% |
| Immigrants | Liberia | 0.4 /100 | #263 | Tragic 2.5% |
| Indians (Asian) | 0.4 /100 | #264 | Tragic 2.5% |