Immigrants from Kenya vs Czech College, Under 1 year
COMPARE
Immigrants from Kenya
Czech
College, Under 1 year
College, Under 1 year Comparison
Immigrants from Kenya
Czechs
66.5%
COLLEGE, UNDER 1 YEAR
81.8/ 100
METRIC RATING
145th/ 347
METRIC RANK
67.1%
COLLEGE, UNDER 1 YEAR
90.8/ 100
METRIC RATING
127th/ 347
METRIC RANK
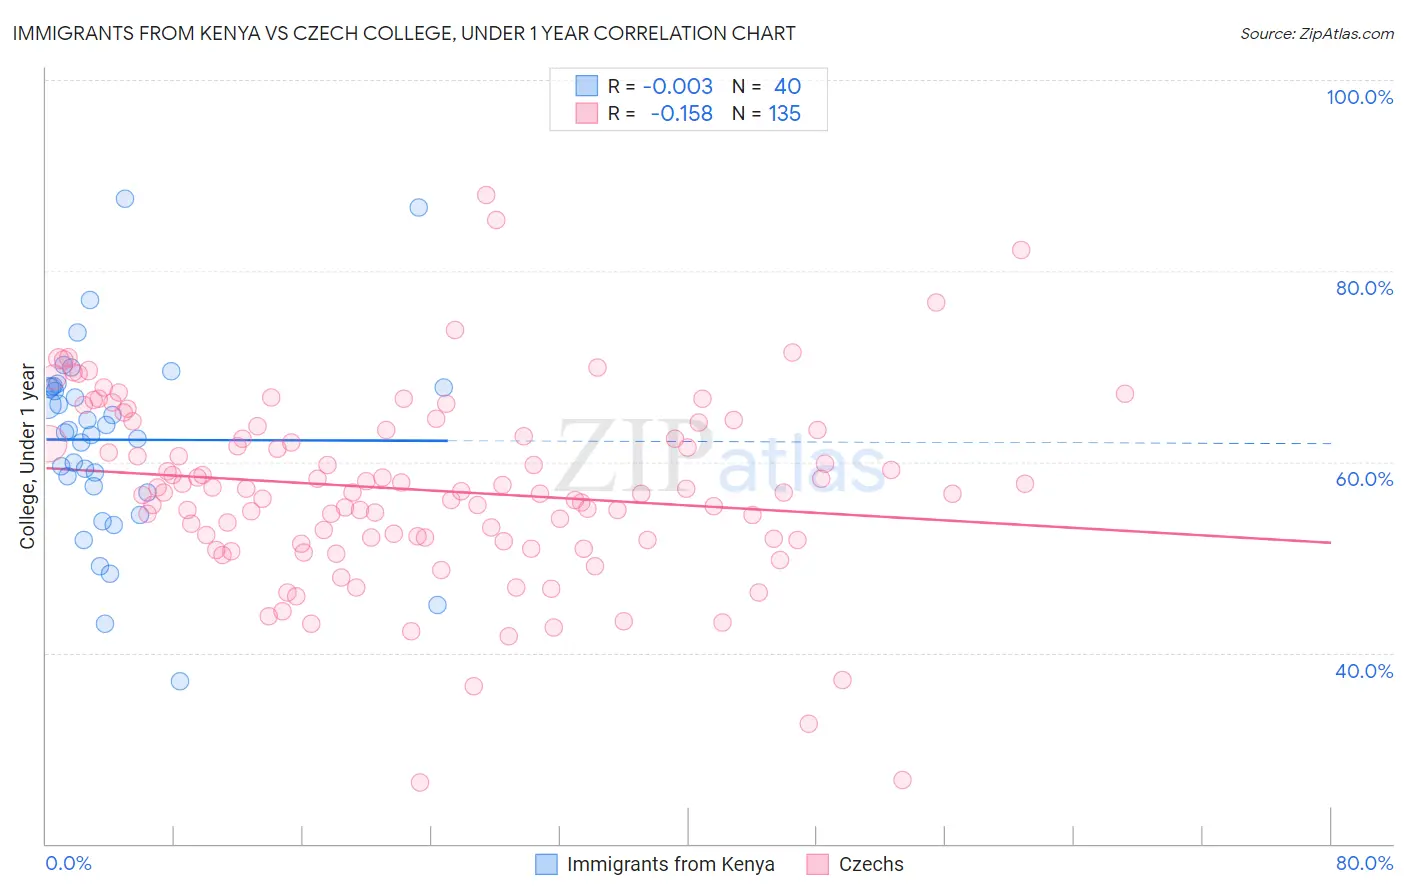
Immigrants from Kenya vs Czech College, Under 1 year Correlation Chart
The statistical analysis conducted on geographies consisting of 218,085,582 people shows no correlation between the proportion of Immigrants from Kenya and percentage of population with at least college, under 1 year education in the United States with a correlation coefficient (R) of -0.003 and weighted average of 66.5%. Similarly, the statistical analysis conducted on geographies consisting of 484,811,480 people shows a poor negative correlation between the proportion of Czechs and percentage of population with at least college, under 1 year education in the United States with a correlation coefficient (R) of -0.158 and weighted average of 67.1%, a difference of 0.85%.
College, Under 1 year Correlation Summary
| Measurement | Immigrants from Kenya | Czech |
| Minimum | 37.0% | 26.5% |
| Maximum | 87.6% | 88.0% |
| Range | 50.6% | 61.5% |
| Mean | 62.3% | 57.1% |
| Median | 63.2% | 56.8% |
| Interquartile 25% (IQ1) | 57.1% | 51.8% |
| Interquartile 75% (IQ3) | 67.8% | 63.3% |
| Interquartile Range (IQR) | 10.7% | 11.5% |
| Standard Deviation (Sample) | 10.3% | 9.8% |
| Standard Deviation (Population) | 10.1% | 9.8% |
Demographics Similar to Immigrants from Kenya and Czechs by College, Under 1 year
In terms of college, under 1 year, the demographic groups most similar to Immigrants from Kenya are Kenyan (66.5%, a difference of 0.0%), Immigrants from Germany (66.5%, a difference of 0.010%), Immigrants from Uganda (66.5%, a difference of 0.070%), English (66.6%, a difference of 0.090%), and Immigrants from Afghanistan (66.7%, a difference of 0.26%). Similarly, the demographic groups most similar to Czechs are Scottish (67.0%, a difference of 0.070%), Alsatian (67.1%, a difference of 0.080%), Immigrants from Eastern Africa (67.0%, a difference of 0.15%), Immigrants from Syria (66.9%, a difference of 0.21%), and Finnish (66.9%, a difference of 0.25%).
| Demographics | Rating | Rank | College, Under 1 year |
| Alsatians | 91.3 /100 | #126 | Exceptional 67.1% |
| Czechs | 90.8 /100 | #127 | Exceptional 67.1% |
| Scottish | 90.2 /100 | #128 | Exceptional 67.0% |
| Immigrants | Eastern Africa | 89.5 /100 | #129 | Excellent 67.0% |
| Immigrants | Syria | 89.0 /100 | #130 | Excellent 66.9% |
| Finns | 88.6 /100 | #131 | Excellent 66.9% |
| Poles | 88.4 /100 | #132 | Excellent 66.9% |
| Immigrants | Brazil | 88.3 /100 | #133 | Excellent 66.9% |
| Iraqis | 88.0 /100 | #134 | Excellent 66.8% |
| Canadians | 87.9 /100 | #135 | Excellent 66.8% |
| Ugandans | 87.8 /100 | #136 | Excellent 66.8% |
| Immigrants | Chile | 87.4 /100 | #137 | Excellent 66.8% |
| Immigrants | Italy | 86.9 /100 | #138 | Excellent 66.8% |
| Venezuelans | 85.9 /100 | #139 | Excellent 66.7% |
| Slavs | 85.9 /100 | #140 | Excellent 66.7% |
| Immigrants | Afghanistan | 85.1 /100 | #141 | Excellent 66.7% |
| English | 82.9 /100 | #142 | Excellent 66.6% |
| Immigrants | Uganda | 82.8 /100 | #143 | Excellent 66.5% |
| Immigrants | Germany | 82.0 /100 | #144 | Excellent 66.5% |
| Immigrants | Kenya | 81.8 /100 | #145 | Excellent 66.5% |
| Kenyans | 81.7 /100 | #146 | Excellent 66.5% |