Immigrants from Panama vs Czech College, Under 1 year
COMPARE
Immigrants from Panama
Czech
College, Under 1 year
College, Under 1 year Comparison
Immigrants from Panama
Czechs
63.4%
COLLEGE, UNDER 1 YEAR
5.7/ 100
METRIC RATING
218th/ 347
METRIC RANK
67.1%
COLLEGE, UNDER 1 YEAR
90.8/ 100
METRIC RATING
127th/ 347
METRIC RANK
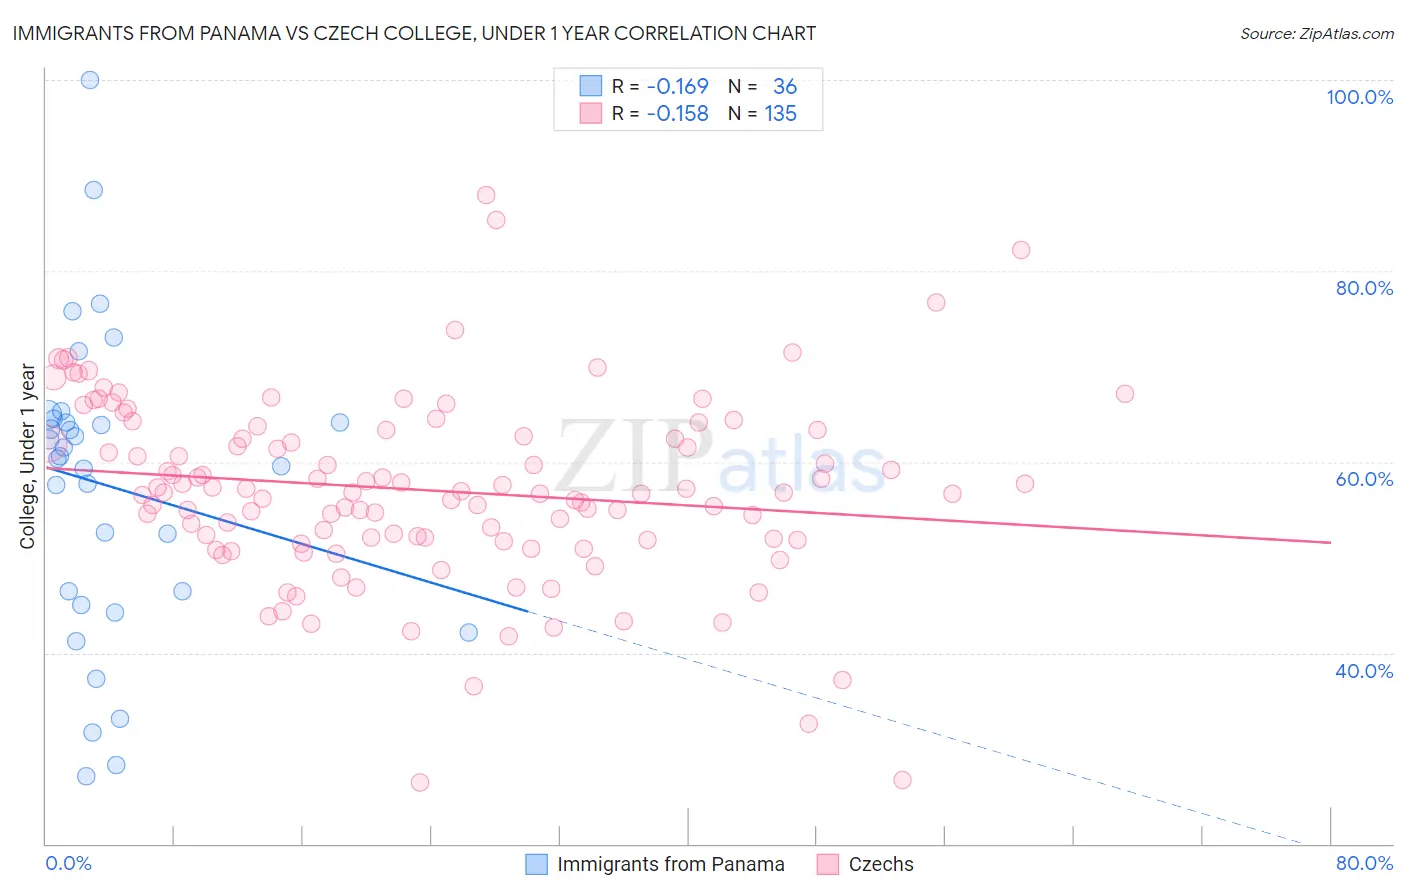
Immigrants from Panama vs Czech College, Under 1 year Correlation Chart
The statistical analysis conducted on geographies consisting of 221,184,524 people shows a poor negative correlation between the proportion of Immigrants from Panama and percentage of population with at least college, under 1 year education in the United States with a correlation coefficient (R) of -0.169 and weighted average of 63.4%. Similarly, the statistical analysis conducted on geographies consisting of 484,811,480 people shows a poor negative correlation between the proportion of Czechs and percentage of population with at least college, under 1 year education in the United States with a correlation coefficient (R) of -0.158 and weighted average of 67.1%, a difference of 5.8%.
College, Under 1 year Correlation Summary
| Measurement | Immigrants from Panama | Czech |
| Minimum | 27.1% | 26.5% |
| Maximum | 100.0% | 88.0% |
| Range | 72.9% | 61.5% |
| Mean | 57.5% | 57.1% |
| Median | 60.4% | 56.8% |
| Interquartile 25% (IQ1) | 45.7% | 51.8% |
| Interquartile 75% (IQ3) | 64.4% | 63.3% |
| Interquartile Range (IQR) | 18.6% | 11.5% |
| Standard Deviation (Sample) | 16.0% | 9.8% |
| Standard Deviation (Population) | 15.8% | 9.8% |
Similar Demographics by College, Under 1 year
Demographics Similar to Immigrants from Panama by College, Under 1 year
In terms of college, under 1 year, the demographic groups most similar to Immigrants from Panama are Immigrants from Fiji (63.4%, a difference of 0.010%), Immigrants from Uruguay (63.4%, a difference of 0.020%), Portuguese (63.4%, a difference of 0.030%), Cree (63.3%, a difference of 0.11%), and Immigrants from Senegal (63.3%, a difference of 0.16%).
| Demographics | Rating | Rank | College, Under 1 year |
| Native Hawaiians | 10.6 /100 | #211 | Poor 63.9% |
| Immigrants | Middle Africa | 10.5 /100 | #212 | Poor 63.9% |
| Immigrants | South America | 9.1 /100 | #213 | Tragic 63.8% |
| Immigrants | Nigeria | 8.8 /100 | #214 | Tragic 63.7% |
| Senegalese | 7.7 /100 | #215 | Tragic 63.6% |
| Hmong | 6.8 /100 | #216 | Tragic 63.5% |
| Immigrants | Uruguay | 5.8 /100 | #217 | Tragic 63.4% |
| Immigrants | Panama | 5.7 /100 | #218 | Tragic 63.4% |
| Immigrants | Fiji | 5.7 /100 | #219 | Tragic 63.4% |
| Portuguese | 5.6 /100 | #220 | Tragic 63.4% |
| Cree | 5.2 /100 | #221 | Tragic 63.3% |
| Immigrants | Senegal | 5.0 /100 | #222 | Tragic 63.3% |
| Immigrants | Costa Rica | 4.5 /100 | #223 | Tragic 63.2% |
| Sub-Saharan Africans | 4.4 /100 | #224 | Tragic 63.2% |
| Immigrants | Peru | 4.0 /100 | #225 | Tragic 63.1% |
Demographics Similar to Czechs by College, Under 1 year
In terms of college, under 1 year, the demographic groups most similar to Czechs are Scottish (67.0%, a difference of 0.070%), Alsatian (67.1%, a difference of 0.080%), Italian (67.2%, a difference of 0.14%), Immigrants from Eastern Africa (67.0%, a difference of 0.15%), and Immigrants from Syria (66.9%, a difference of 0.21%).
| Demographics | Rating | Rank | College, Under 1 year |
| Serbians | 93.9 /100 | #120 | Exceptional 67.4% |
| Slovenes | 93.3 /100 | #121 | Exceptional 67.3% |
| Immigrants | Jordan | 92.8 /100 | #122 | Exceptional 67.3% |
| Immigrants | Northern Africa | 92.7 /100 | #123 | Exceptional 67.2% |
| Arabs | 92.6 /100 | #124 | Exceptional 67.2% |
| Italians | 91.8 /100 | #125 | Exceptional 67.2% |
| Alsatians | 91.3 /100 | #126 | Exceptional 67.1% |
| Czechs | 90.8 /100 | #127 | Exceptional 67.1% |
| Scottish | 90.2 /100 | #128 | Exceptional 67.0% |
| Immigrants | Eastern Africa | 89.5 /100 | #129 | Excellent 67.0% |
| Immigrants | Syria | 89.0 /100 | #130 | Excellent 66.9% |
| Finns | 88.6 /100 | #131 | Excellent 66.9% |
| Poles | 88.4 /100 | #132 | Excellent 66.9% |
| Immigrants | Brazil | 88.3 /100 | #133 | Excellent 66.9% |
| Iraqis | 88.0 /100 | #134 | Excellent 66.8% |