Austrian vs Czech College, Under 1 year
COMPARE
Austrian
Czech
College, Under 1 year
College, Under 1 year Comparison
Austrians
Czechs
67.8%
COLLEGE, UNDER 1 YEAR
96.4/ 100
METRIC RATING
107th/ 347
METRIC RANK
67.1%
COLLEGE, UNDER 1 YEAR
90.8/ 100
METRIC RATING
127th/ 347
METRIC RANK
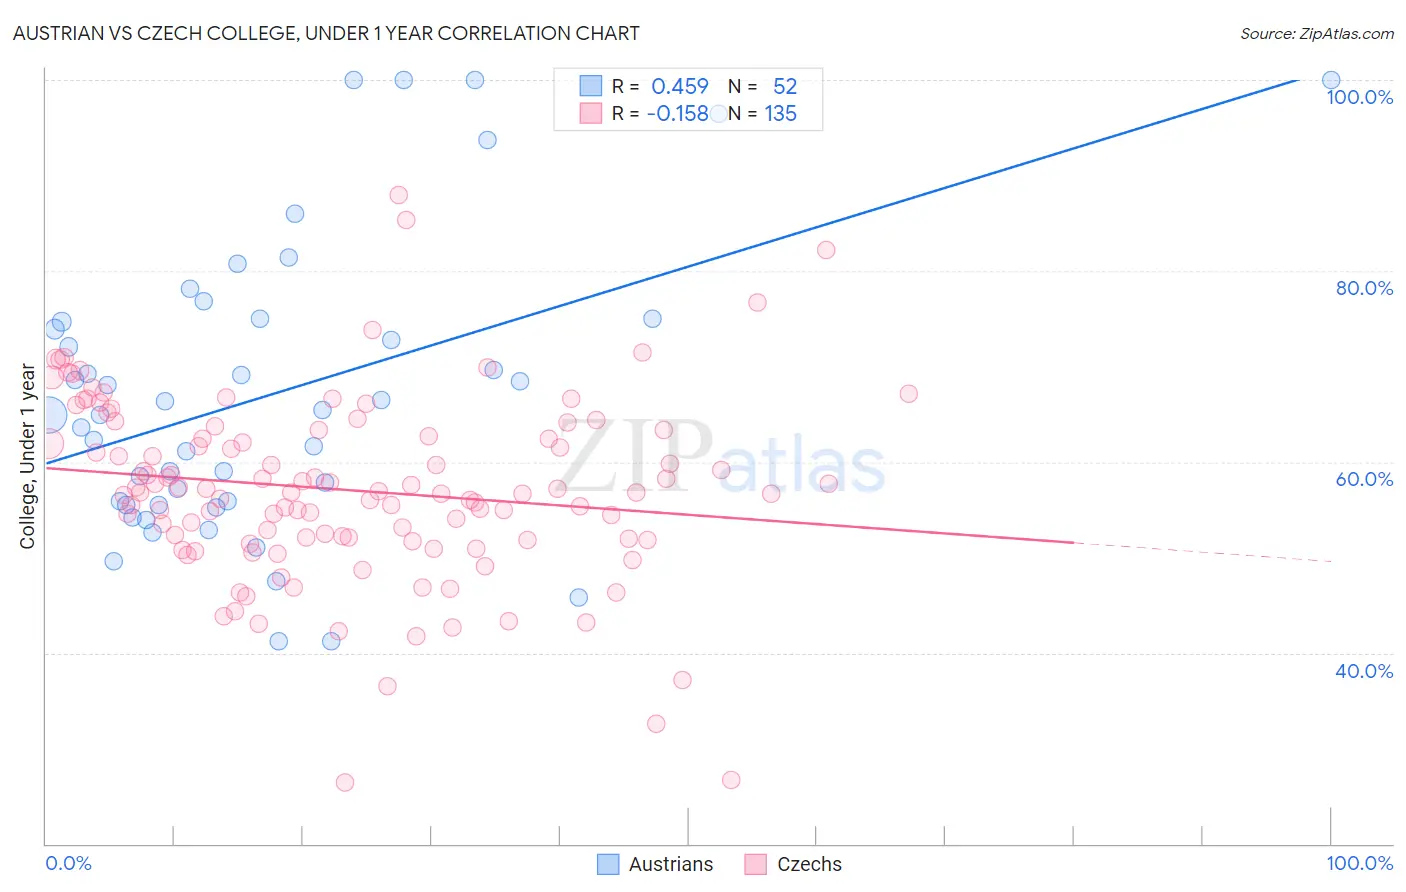
Austrian vs Czech College, Under 1 year Correlation Chart
The statistical analysis conducted on geographies consisting of 452,079,240 people shows a moderate positive correlation between the proportion of Austrians and percentage of population with at least college, under 1 year education in the United States with a correlation coefficient (R) of 0.459 and weighted average of 67.8%. Similarly, the statistical analysis conducted on geographies consisting of 484,811,480 people shows a poor negative correlation between the proportion of Czechs and percentage of population with at least college, under 1 year education in the United States with a correlation coefficient (R) of -0.158 and weighted average of 67.1%, a difference of 1.1%.
College, Under 1 year Correlation Summary
| Measurement | Austrian | Czech |
| Minimum | 41.2% | 26.5% |
| Maximum | 100.0% | 88.0% |
| Range | 58.8% | 61.5% |
| Mean | 67.0% | 57.1% |
| Median | 65.2% | 56.8% |
| Interquartile 25% (IQ1) | 55.7% | 51.8% |
| Interquartile 75% (IQ3) | 74.8% | 63.3% |
| Interquartile Range (IQR) | 19.1% | 11.5% |
| Standard Deviation (Sample) | 15.2% | 9.8% |
| Standard Deviation (Population) | 15.1% | 9.8% |
Demographics Similar to Austrians and Czechs by College, Under 1 year
In terms of college, under 1 year, the demographic groups most similar to Austrians are Immigrants from Egypt (67.7%, a difference of 0.12%), Scandinavian (67.7%, a difference of 0.18%), Assyrian/Chaldean/Syriac (67.7%, a difference of 0.18%), Ukrainian (67.7%, a difference of 0.18%), and Macedonian (67.6%, a difference of 0.20%). Similarly, the demographic groups most similar to Czechs are Alsatian (67.1%, a difference of 0.080%), Italian (67.2%, a difference of 0.14%), Arab (67.2%, a difference of 0.26%), Immigrants from Northern Africa (67.2%, a difference of 0.27%), and Immigrants from Jordan (67.3%, a difference of 0.29%).
| Demographics | Rating | Rank | College, Under 1 year |
| Austrians | 96.4 /100 | #107 | Exceptional 67.8% |
| Immigrants | Egypt | 96.0 /100 | #108 | Exceptional 67.7% |
| Scandinavians | 95.8 /100 | #109 | Exceptional 67.7% |
| Assyrians/Chaldeans/Syriacs | 95.8 /100 | #110 | Exceptional 67.7% |
| Ukrainians | 95.8 /100 | #111 | Exceptional 67.7% |
| Macedonians | 95.7 /100 | #112 | Exceptional 67.6% |
| Syrians | 95.6 /100 | #113 | Exceptional 67.6% |
| Chileans | 95.3 /100 | #114 | Exceptional 67.6% |
| Basques | 95.2 /100 | #115 | Exceptional 67.6% |
| Immigrants | Nepal | 94.9 /100 | #116 | Exceptional 67.5% |
| Pakistanis | 94.8 /100 | #117 | Exceptional 67.5% |
| Immigrants | Ukraine | 94.7 /100 | #118 | Exceptional 67.5% |
| Lebanese | 94.6 /100 | #119 | Exceptional 67.5% |
| Serbians | 93.9 /100 | #120 | Exceptional 67.4% |
| Slovenes | 93.3 /100 | #121 | Exceptional 67.3% |
| Immigrants | Jordan | 92.8 /100 | #122 | Exceptional 67.3% |
| Immigrants | Northern Africa | 92.7 /100 | #123 | Exceptional 67.2% |
| Arabs | 92.6 /100 | #124 | Exceptional 67.2% |
| Italians | 91.8 /100 | #125 | Exceptional 67.2% |
| Alsatians | 91.3 /100 | #126 | Exceptional 67.1% |
| Czechs | 90.8 /100 | #127 | Exceptional 67.1% |