Immigrants from St. Vincent and the Grenadines vs Immigrants from Sierra Leone College, 1 year or more
COMPARE
Immigrants from St. Vincent and the Grenadines
Immigrants from Sierra Leone
College, 1 year or more
College, 1 year or more Comparison
Immigrants from St. Vincent and the Grenadines
Immigrants from Sierra Leone
54.8%
COLLEGE, 1 YEAR OR MORE
0.3/ 100
METRIC RATING
262nd/ 347
METRIC RANK
59.5%
COLLEGE, 1 YEAR OR MORE
52.2/ 100
METRIC RATING
172nd/ 347
METRIC RANK
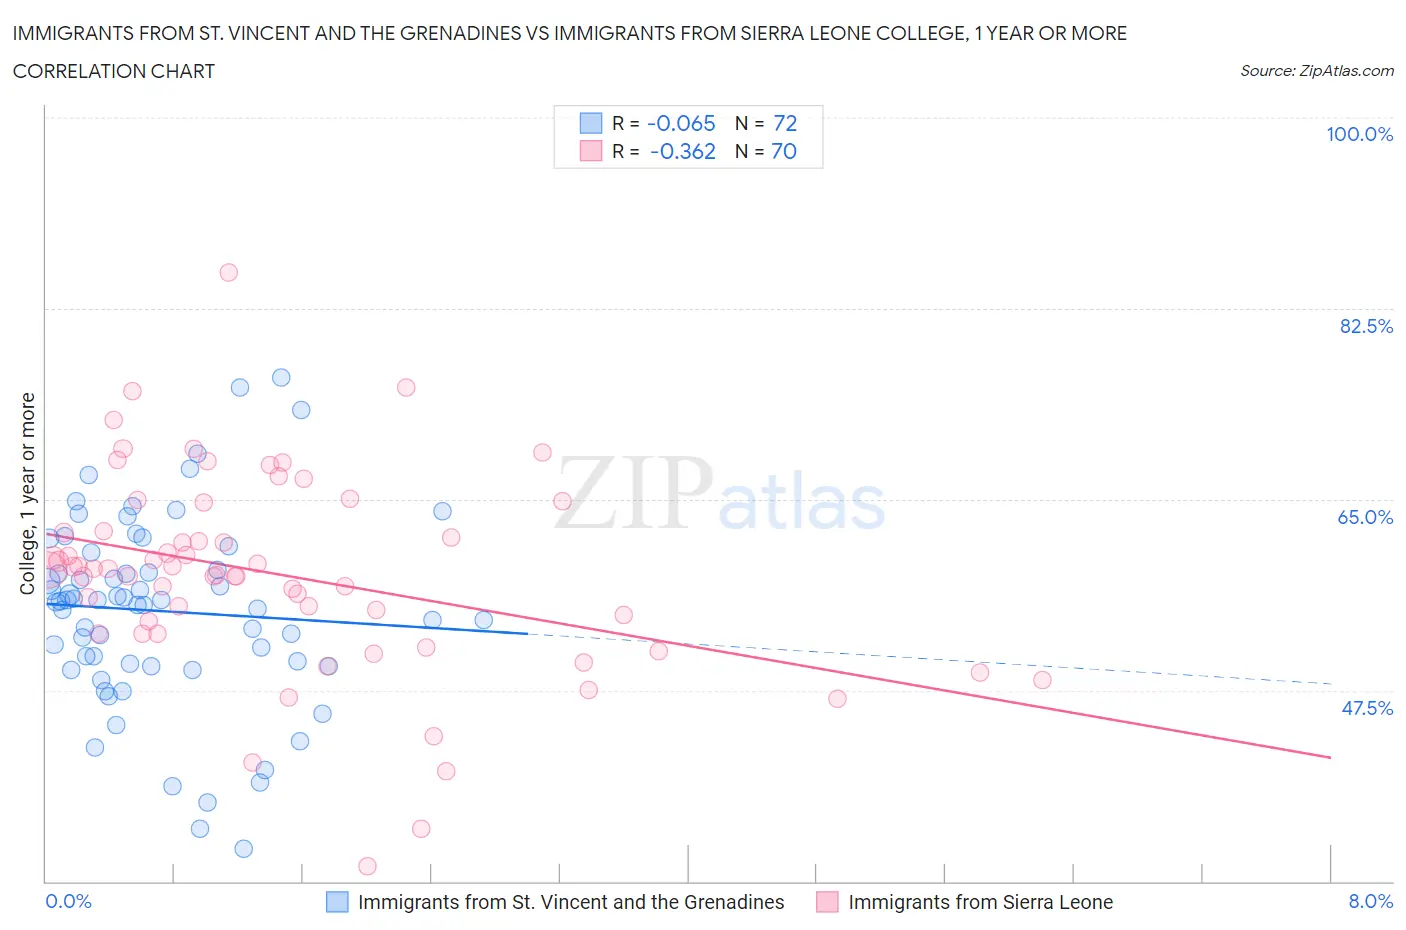
Immigrants from St. Vincent and the Grenadines vs Immigrants from Sierra Leone College, 1 year or more Correlation Chart
The statistical analysis conducted on geographies consisting of 56,185,220 people shows a slight negative correlation between the proportion of Immigrants from St. Vincent and the Grenadines and percentage of population with at least college, 1 year or more education in the United States with a correlation coefficient (R) of -0.065 and weighted average of 54.8%. Similarly, the statistical analysis conducted on geographies consisting of 101,652,497 people shows a mild negative correlation between the proportion of Immigrants from Sierra Leone and percentage of population with at least college, 1 year or more education in the United States with a correlation coefficient (R) of -0.362 and weighted average of 59.5%, a difference of 8.5%.
College, 1 year or more Correlation Summary
| Measurement | Immigrants from St. Vincent and the Grenadines | Immigrants from Sierra Leone |
| Minimum | 33.0% | 31.4% |
| Maximum | 76.2% | 85.8% |
| Range | 43.2% | 54.4% |
| Mean | 54.8% | 58.1% |
| Median | 55.6% | 58.6% |
| Interquartile 25% (IQ1) | 49.8% | 52.7% |
| Interquartile 75% (IQ3) | 59.3% | 62.1% |
| Interquartile Range (IQR) | 9.5% | 9.4% |
| Standard Deviation (Sample) | 8.8% | 9.2% |
| Standard Deviation (Population) | 8.7% | 9.2% |
Similar Demographics by College, 1 year or more
Demographics Similar to Immigrants from St. Vincent and the Grenadines by College, 1 year or more
In terms of college, 1 year or more, the demographic groups most similar to Immigrants from St. Vincent and the Grenadines are U.S. Virgin Islander (54.8%, a difference of 0.020%), Immigrants from Micronesia (54.8%, a difference of 0.050%), Ottawa (54.9%, a difference of 0.080%), Jamaican (54.9%, a difference of 0.11%), and Nepalese (54.9%, a difference of 0.21%).
| Demographics | Rating | Rank | College, 1 year or more |
| Immigrants | Bahamas | 0.5 /100 | #255 | Tragic 55.2% |
| Immigrants | West Indies | 0.5 /100 | #256 | Tragic 55.2% |
| Indonesians | 0.4 /100 | #257 | Tragic 55.1% |
| Africans | 0.4 /100 | #258 | Tragic 55.0% |
| Nepalese | 0.3 /100 | #259 | Tragic 54.9% |
| Jamaicans | 0.3 /100 | #260 | Tragic 54.9% |
| Ottawa | 0.3 /100 | #261 | Tragic 54.9% |
| Immigrants | St. Vincent and the Grenadines | 0.3 /100 | #262 | Tragic 54.8% |
| U.S. Virgin Islanders | 0.3 /100 | #263 | Tragic 54.8% |
| Immigrants | Micronesia | 0.3 /100 | #264 | Tragic 54.8% |
| Immigrants | Laos | 0.2 /100 | #265 | Tragic 54.7% |
| Potawatomi | 0.2 /100 | #266 | Tragic 54.6% |
| Blackfeet | 0.2 /100 | #267 | Tragic 54.6% |
| British West Indians | 0.2 /100 | #268 | Tragic 54.5% |
| Bangladeshis | 0.2 /100 | #269 | Tragic 54.5% |
Demographics Similar to Immigrants from Sierra Leone by College, 1 year or more
In terms of college, 1 year or more, the demographic groups most similar to Immigrants from Sierra Leone are Welsh (59.5%, a difference of 0.010%), Immigrants from Albania (59.5%, a difference of 0.010%), Immigrants from Southern Europe (59.5%, a difference of 0.030%), Hungarian (59.5%, a difference of 0.040%), and Immigrants from North Macedonia (59.5%, a difference of 0.050%).
| Demographics | Rating | Rank | College, 1 year or more |
| Irish | 56.1 /100 | #165 | Average 59.6% |
| Immigrants | Africa | 56.1 /100 | #166 | Average 59.6% |
| Immigrants | North Macedonia | 53.1 /100 | #167 | Average 59.5% |
| Hungarians | 52.9 /100 | #168 | Average 59.5% |
| Immigrants | Southern Europe | 52.7 /100 | #169 | Average 59.5% |
| Welsh | 52.4 /100 | #170 | Average 59.5% |
| Immigrants | Albania | 52.3 /100 | #171 | Average 59.5% |
| Immigrants | Sierra Leone | 52.2 /100 | #172 | Average 59.5% |
| Immigrants | Oceania | 51.2 /100 | #173 | Average 59.4% |
| Celtics | 50.0 /100 | #174 | Average 59.4% |
| Sri Lankans | 49.0 /100 | #175 | Average 59.4% |
| Immigrants | Poland | 48.9 /100 | #176 | Average 59.4% |
| Tlingit-Haida | 48.4 /100 | #177 | Average 59.4% |
| Czechoslovakians | 48.3 /100 | #178 | Average 59.4% |
| Bermudans | 46.6 /100 | #179 | Average 59.3% |