Canadian vs Immigrants from Sierra Leone Female Disability
COMPARE
Canadian
Immigrants from Sierra Leone
Female Disability
Female Disability Comparison
Canadians
Immigrants from Sierra Leone
12.6%
FEMALE DISABILITY
2.6/ 100
METRIC RATING
242nd/ 347
METRIC RANK
11.6%
FEMALE DISABILITY
99.4/ 100
METRIC RATING
93rd/ 347
METRIC RANK
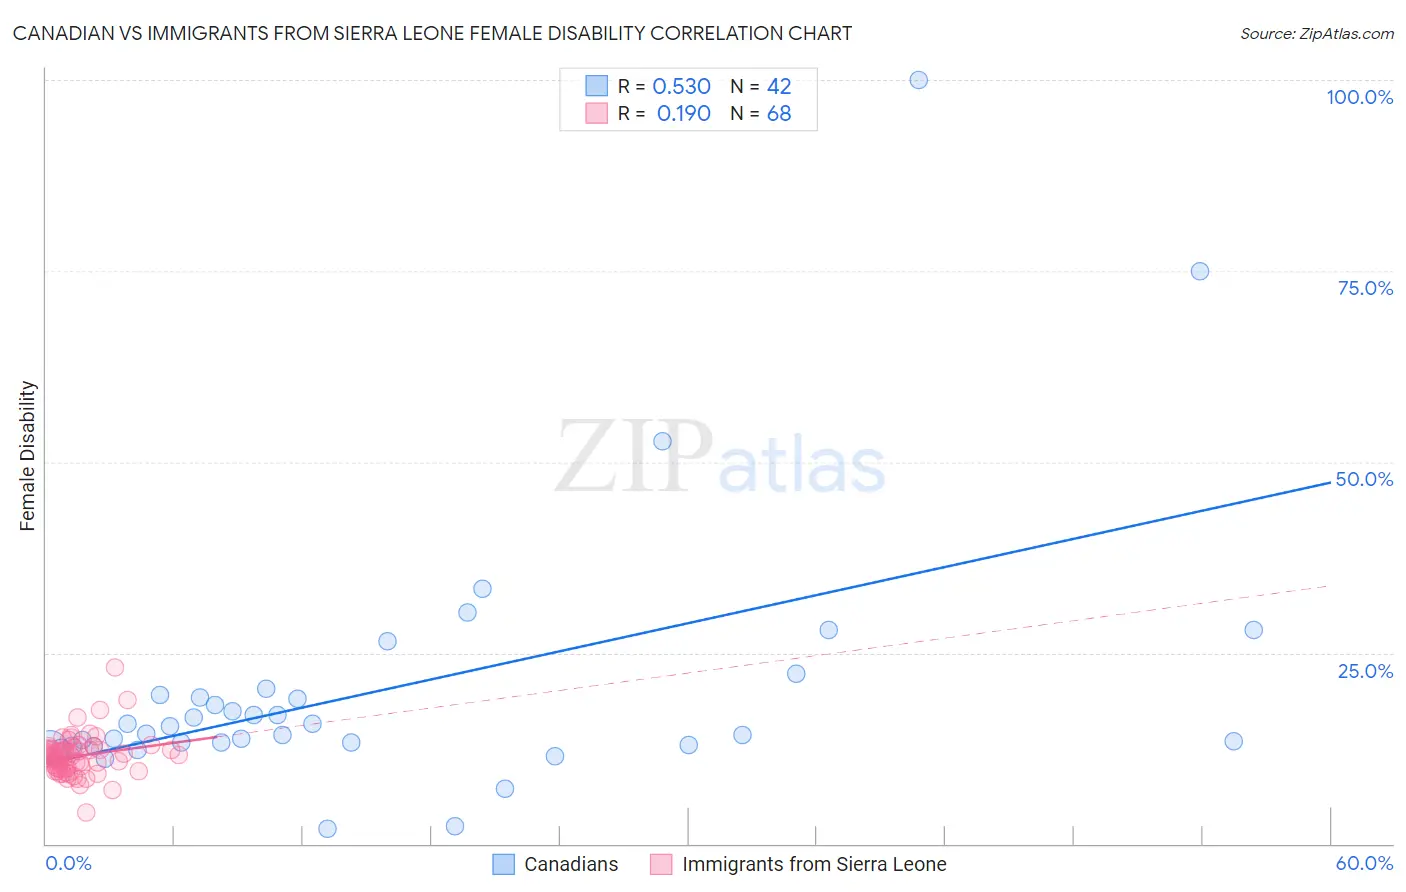
Canadian vs Immigrants from Sierra Leone Female Disability Correlation Chart
The statistical analysis conducted on geographies consisting of 437,475,870 people shows a substantial positive correlation between the proportion of Canadians and percentage of females with a disability in the United States with a correlation coefficient (R) of 0.530 and weighted average of 12.6%. Similarly, the statistical analysis conducted on geographies consisting of 101,646,950 people shows a poor positive correlation between the proportion of Immigrants from Sierra Leone and percentage of females with a disability in the United States with a correlation coefficient (R) of 0.190 and weighted average of 11.6%, a difference of 8.7%.
Female Disability Correlation Summary
| Measurement | Canadian | Immigrants from Sierra Leone |
| Minimum | 2.0% | 4.1% |
| Maximum | 100.0% | 23.1% |
| Range | 98.0% | 18.9% |
| Mean | 20.3% | 11.5% |
| Median | 14.9% | 11.5% |
| Interquartile 25% (IQ1) | 12.9% | 9.8% |
| Interquartile 75% (IQ3) | 19.4% | 12.3% |
| Interquartile Range (IQR) | 6.5% | 2.5% |
| Standard Deviation (Sample) | 17.6% | 2.7% |
| Standard Deviation (Population) | 17.4% | 2.7% |
Similar Demographics by Female Disability
Demographics Similar to Canadians by Female Disability
In terms of female disability, the demographic groups most similar to Canadians are Immigrants from Senegal (12.6%, a difference of 0.010%), Alsatian (12.6%, a difference of 0.020%), Japanese (12.6%, a difference of 0.050%), Immigrants from Jamaica (12.6%, a difference of 0.16%), and Spanish American Indian (12.6%, a difference of 0.18%).
| Demographics | Rating | Rank | Female Disability |
| Malaysians | 5.0 /100 | #235 | Tragic 12.5% |
| Immigrants | West Indies | 4.4 /100 | #236 | Tragic 12.6% |
| Slavs | 3.8 /100 | #237 | Tragic 12.6% |
| Yugoslavians | 3.7 /100 | #238 | Tragic 12.6% |
| Barbadians | 3.6 /100 | #239 | Tragic 12.6% |
| German Russians | 3.2 /100 | #240 | Tragic 12.6% |
| Japanese | 2.7 /100 | #241 | Tragic 12.6% |
| Canadians | 2.6 /100 | #242 | Tragic 12.6% |
| Immigrants | Senegal | 2.5 /100 | #243 | Tragic 12.6% |
| Alsatians | 2.5 /100 | #244 | Tragic 12.6% |
| Immigrants | Jamaica | 2.2 /100 | #245 | Tragic 12.6% |
| Spanish American Indians | 2.1 /100 | #246 | Tragic 12.6% |
| Menominee | 2.1 /100 | #247 | Tragic 12.6% |
| Carpatho Rusyns | 2.0 /100 | #248 | Tragic 12.6% |
| Immigrants | Congo | 1.8 /100 | #249 | Tragic 12.7% |
Demographics Similar to Immigrants from Sierra Leone by Female Disability
In terms of female disability, the demographic groups most similar to Immigrants from Sierra Leone are Immigrants from Brazil (11.6%, a difference of 0.030%), Immigrants from Czechoslovakia (11.6%, a difference of 0.10%), Immigrants from Northern Europe (11.6%, a difference of 0.10%), Immigrants from Zimbabwe (11.6%, a difference of 0.11%), and Vietnamese (11.6%, a difference of 0.12%).
| Demographics | Rating | Rank | Female Disability |
| Immigrants | Cameroon | 99.6 /100 | #86 | Exceptional 11.6% |
| Immigrants | Denmark | 99.5 /100 | #87 | Exceptional 11.6% |
| Yup'ik | 99.5 /100 | #88 | Exceptional 11.6% |
| Vietnamese | 99.5 /100 | #89 | Exceptional 11.6% |
| Immigrants | Romania | 99.5 /100 | #90 | Exceptional 11.6% |
| Immigrants | Zimbabwe | 99.5 /100 | #91 | Exceptional 11.6% |
| Immigrants | Czechoslovakia | 99.5 /100 | #92 | Exceptional 11.6% |
| Immigrants | Sierra Leone | 99.4 /100 | #93 | Exceptional 11.6% |
| Immigrants | Brazil | 99.4 /100 | #94 | Exceptional 11.6% |
| Immigrants | Northern Europe | 99.4 /100 | #95 | Exceptional 11.6% |
| Immigrants | Russia | 99.0 /100 | #96 | Exceptional 11.7% |
| Koreans | 99.0 /100 | #97 | Exceptional 11.7% |
| Uruguayans | 98.8 /100 | #98 | Exceptional 11.7% |
| Immigrants | Philippines | 98.6 /100 | #99 | Exceptional 11.7% |
| Immigrants | Uruguay | 98.5 /100 | #100 | Exceptional 11.7% |