Cambodian vs Kiowa GED/Equivalency
COMPARE
Cambodian
Kiowa
GED/Equivalency
GED/Equivalency Comparison
Cambodians
Kiowa
88.2%
GED/EQUIVALENCY
99.6/ 100
METRIC RATING
42nd/ 347
METRIC RANK
83.1%
GED/EQUIVALENCY
0.2/ 100
METRIC RATING
266th/ 347
METRIC RANK
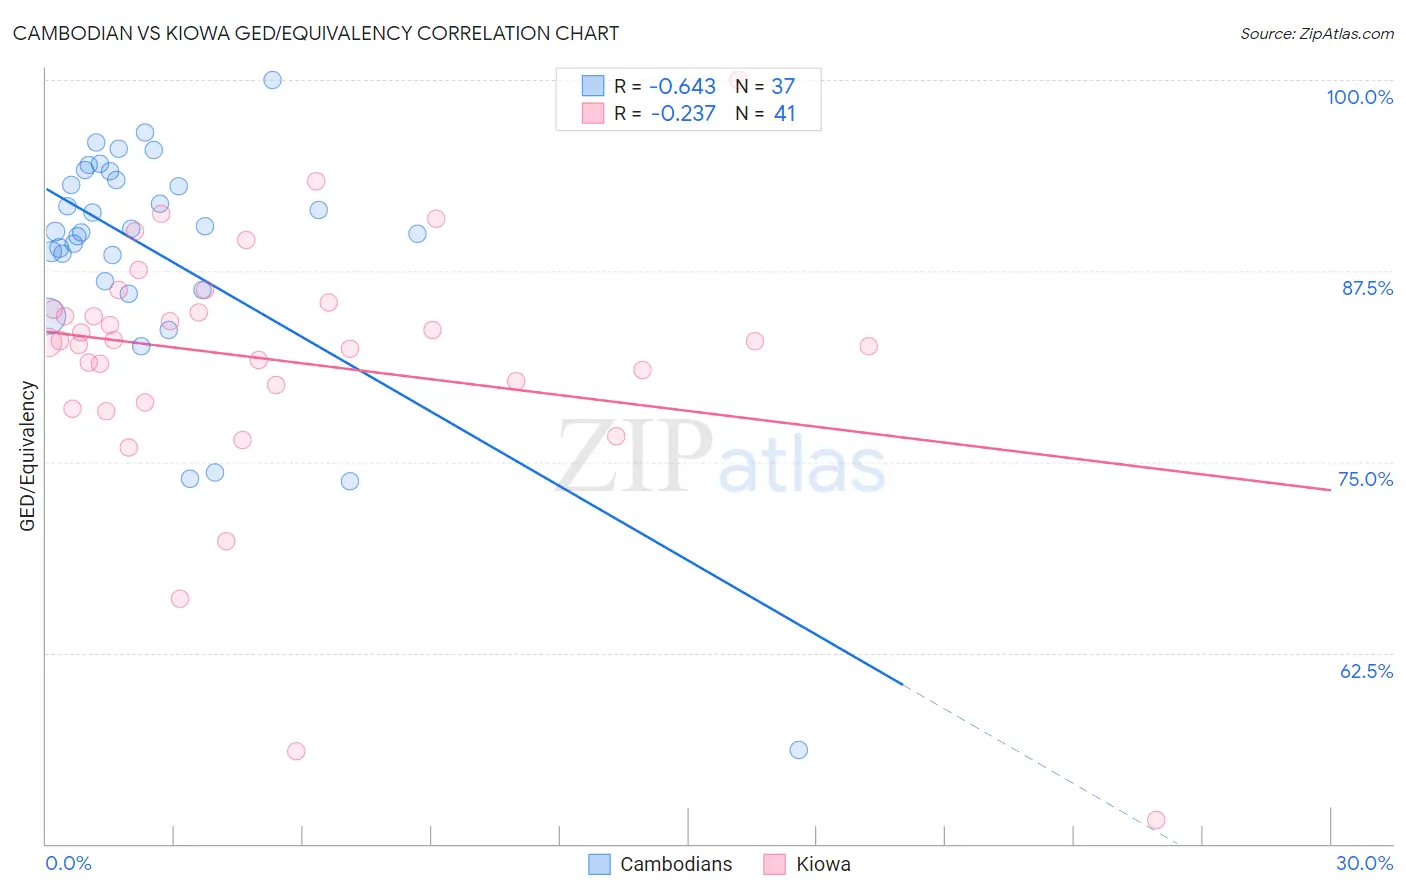
Cambodian vs Kiowa GED/Equivalency Correlation Chart
The statistical analysis conducted on geographies consisting of 102,514,874 people shows a significant negative correlation between the proportion of Cambodians and percentage of population with at least ged/equivalency education in the United States with a correlation coefficient (R) of -0.643 and weighted average of 88.2%. Similarly, the statistical analysis conducted on geographies consisting of 56,101,840 people shows a weak negative correlation between the proportion of Kiowa and percentage of population with at least ged/equivalency education in the United States with a correlation coefficient (R) of -0.237 and weighted average of 83.1%, a difference of 6.1%.
GED/Equivalency Correlation Summary
| Measurement | Cambodian | Kiowa |
| Minimum | 56.1% | 51.6% |
| Maximum | 100.0% | 100.0% |
| Range | 43.9% | 48.4% |
| Mean | 88.6% | 81.7% |
| Median | 90.1% | 82.9% |
| Interquartile 25% (IQ1) | 86.5% | 79.5% |
| Interquartile 75% (IQ3) | 93.8% | 85.2% |
| Interquartile Range (IQR) | 7.2% | 5.8% |
| Standard Deviation (Sample) | 8.1% | 8.7% |
| Standard Deviation (Population) | 8.0% | 8.6% |
Similar Demographics by GED/Equivalency
Demographics Similar to Cambodians by GED/Equivalency
In terms of ged/equivalency, the demographic groups most similar to Cambodians are Immigrants from Scotland (88.2%, a difference of 0.0%), Finnish (88.2%, a difference of 0.030%), Italian (88.2%, a difference of 0.040%), Macedonian (88.1%, a difference of 0.040%), and Immigrants from Israel (88.2%, a difference of 0.060%).
| Demographics | Rating | Rank | GED/Equivalency |
| Immigrants | South Central Asia | 99.7 /100 | #35 | Exceptional 88.4% |
| Immigrants | Belgium | 99.7 /100 | #36 | Exceptional 88.3% |
| Immigrants | Austria | 99.7 /100 | #37 | Exceptional 88.3% |
| Burmese | 99.7 /100 | #38 | Exceptional 88.3% |
| Immigrants | Israel | 99.6 /100 | #39 | Exceptional 88.2% |
| Italians | 99.6 /100 | #40 | Exceptional 88.2% |
| Finns | 99.6 /100 | #41 | Exceptional 88.2% |
| Cambodians | 99.6 /100 | #42 | Exceptional 88.2% |
| Immigrants | Scotland | 99.6 /100 | #43 | Exceptional 88.2% |
| Macedonians | 99.5 /100 | #44 | Exceptional 88.1% |
| Czechs | 99.5 /100 | #45 | Exceptional 88.1% |
| Immigrants | Switzerland | 99.5 /100 | #46 | Exceptional 88.1% |
| Immigrants | Latvia | 99.5 /100 | #47 | Exceptional 88.1% |
| Greeks | 99.5 /100 | #48 | Exceptional 88.1% |
| Australians | 99.5 /100 | #49 | Exceptional 88.1% |
Demographics Similar to Kiowa by GED/Equivalency
In terms of ged/equivalency, the demographic groups most similar to Kiowa are Bangladeshi (83.1%, a difference of 0.010%), West Indian (83.1%, a difference of 0.010%), Trinidadian and Tobagonian (83.0%, a difference of 0.020%), Immigrants from Congo (83.1%, a difference of 0.030%), and Inupiat (83.1%, a difference of 0.040%).
| Demographics | Rating | Rank | GED/Equivalency |
| Immigrants | Vietnam | 0.3 /100 | #259 | Tragic 83.2% |
| Choctaw | 0.3 /100 | #260 | Tragic 83.1% |
| Inupiat | 0.2 /100 | #261 | Tragic 83.1% |
| Immigrants | Armenia | 0.2 /100 | #262 | Tragic 83.1% |
| Immigrants | Congo | 0.2 /100 | #263 | Tragic 83.1% |
| Bangladeshis | 0.2 /100 | #264 | Tragic 83.1% |
| West Indians | 0.2 /100 | #265 | Tragic 83.1% |
| Kiowa | 0.2 /100 | #266 | Tragic 83.1% |
| Trinidadians and Tobagonians | 0.2 /100 | #267 | Tragic 83.0% |
| Immigrants | Burma/Myanmar | 0.2 /100 | #268 | Tragic 83.0% |
| Hopi | 0.2 /100 | #269 | Tragic 83.0% |
| Immigrants | Jamaica | 0.2 /100 | #270 | Tragic 82.9% |
| U.S. Virgin Islanders | 0.2 /100 | #271 | Tragic 82.9% |
| Barbadians | 0.1 /100 | #272 | Tragic 82.9% |
| Pennsylvania Germans | 0.1 /100 | #273 | Tragic 82.9% |