Cajun vs Arab College, Under 1 year
COMPARE
Cajun
Arab
College, Under 1 year
College, Under 1 year Comparison
Cajuns
Arabs
57.3%
COLLEGE, UNDER 1 YEAR
0.0/ 100
METRIC RATING
311th/ 347
METRIC RANK
67.2%
COLLEGE, UNDER 1 YEAR
92.6/ 100
METRIC RATING
124th/ 347
METRIC RANK
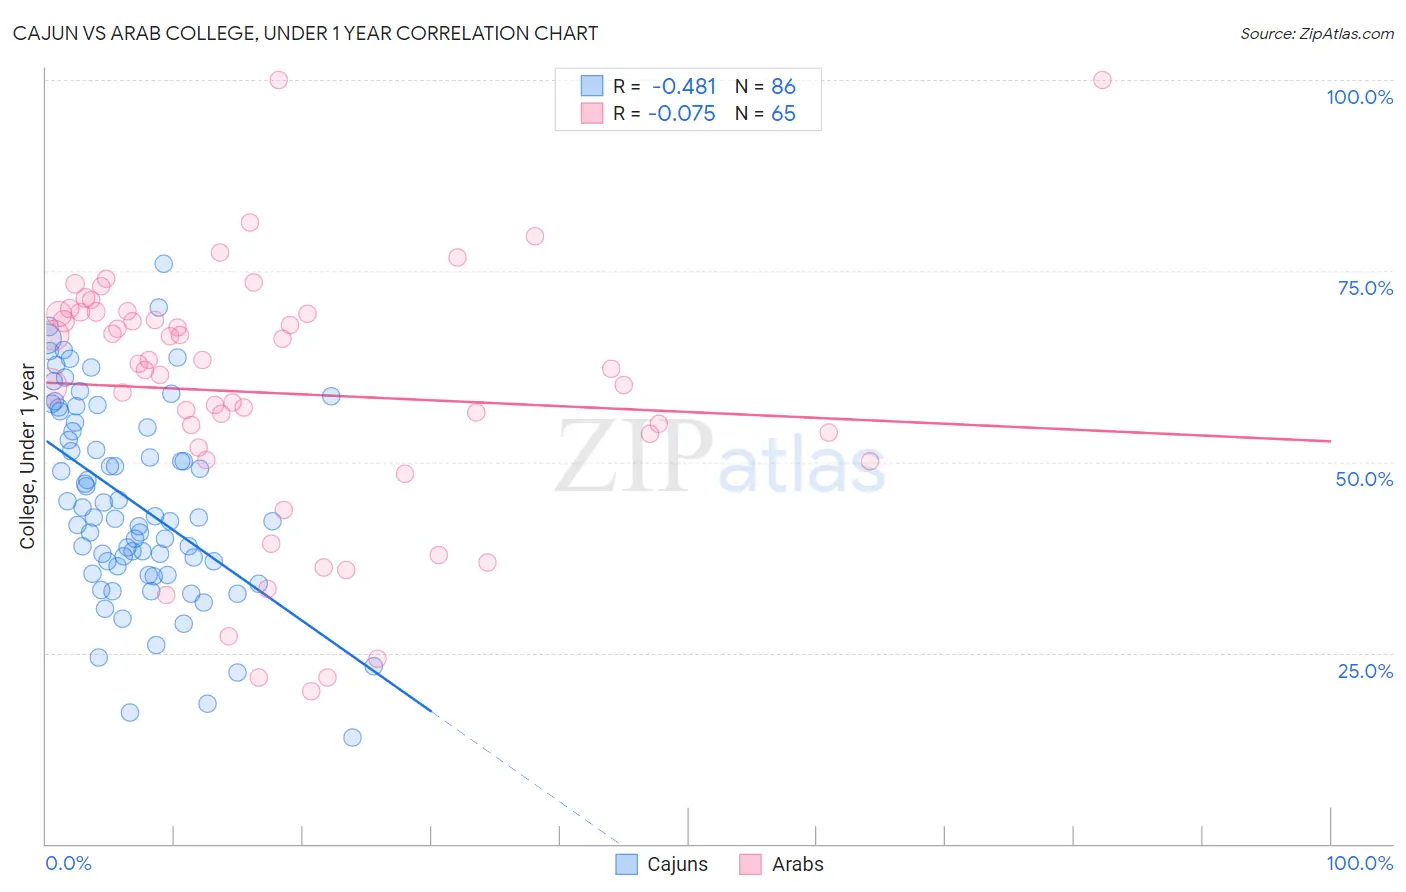
Cajun vs Arab College, Under 1 year Correlation Chart
The statistical analysis conducted on geographies consisting of 149,713,149 people shows a moderate negative correlation between the proportion of Cajuns and percentage of population with at least college, under 1 year education in the United States with a correlation coefficient (R) of -0.481 and weighted average of 57.3%. Similarly, the statistical analysis conducted on geographies consisting of 486,870,114 people shows a slight negative correlation between the proportion of Arabs and percentage of population with at least college, under 1 year education in the United States with a correlation coefficient (R) of -0.075 and weighted average of 67.2%, a difference of 17.3%.
College, Under 1 year Correlation Summary
| Measurement | Cajun | Arab |
| Minimum | 13.9% | 20.0% |
| Maximum | 75.9% | 100.0% |
| Range | 62.0% | 80.0% |
| Mean | 44.8% | 59.0% |
| Median | 42.7% | 62.3% |
| Interquartile 25% (IQ1) | 36.3% | 51.1% |
| Interquartile 75% (IQ3) | 55.2% | 69.5% |
| Interquartile Range (IQR) | 18.9% | 18.5% |
| Standard Deviation (Sample) | 13.0% | 17.0% |
| Standard Deviation (Population) | 12.9% | 16.9% |
Similar Demographics by College, Under 1 year
Demographics Similar to Cajuns by College, Under 1 year
In terms of college, under 1 year, the demographic groups most similar to Cajuns are Pueblo (57.4%, a difference of 0.060%), Salvadoran (57.3%, a difference of 0.070%), Dutch West Indian (57.2%, a difference of 0.31%), Hopi (57.1%, a difference of 0.42%), and Immigrants from Nicaragua (57.6%, a difference of 0.45%).
| Demographics | Rating | Rank | College, Under 1 year |
| Kiowa | 0.0 /100 | #304 | Tragic 57.8% |
| Haitians | 0.0 /100 | #305 | Tragic 57.8% |
| Immigrants | Portugal | 0.0 /100 | #306 | Tragic 57.7% |
| Fijians | 0.0 /100 | #307 | Tragic 57.7% |
| Central Americans | 0.0 /100 | #308 | Tragic 57.7% |
| Immigrants | Nicaragua | 0.0 /100 | #309 | Tragic 57.6% |
| Pueblo | 0.0 /100 | #310 | Tragic 57.4% |
| Cajuns | 0.0 /100 | #311 | Tragic 57.3% |
| Salvadorans | 0.0 /100 | #312 | Tragic 57.3% |
| Dutch West Indians | 0.0 /100 | #313 | Tragic 57.2% |
| Hopi | 0.0 /100 | #314 | Tragic 57.1% |
| Hondurans | 0.0 /100 | #315 | Tragic 57.1% |
| Menominee | 0.0 /100 | #316 | Tragic 57.0% |
| Hispanics or Latinos | 0.0 /100 | #317 | Tragic 57.0% |
| Immigrants | Haiti | 0.0 /100 | #318 | Tragic 56.9% |
Demographics Similar to Arabs by College, Under 1 year
In terms of college, under 1 year, the demographic groups most similar to Arabs are Immigrants from Northern Africa (67.2%, a difference of 0.010%), Immigrants from Jordan (67.3%, a difference of 0.030%), Slovene (67.3%, a difference of 0.12%), Italian (67.2%, a difference of 0.12%), and Alsatian (67.1%, a difference of 0.18%).
| Demographics | Rating | Rank | College, Under 1 year |
| Pakistanis | 94.8 /100 | #117 | Exceptional 67.5% |
| Immigrants | Ukraine | 94.7 /100 | #118 | Exceptional 67.5% |
| Lebanese | 94.6 /100 | #119 | Exceptional 67.5% |
| Serbians | 93.9 /100 | #120 | Exceptional 67.4% |
| Slovenes | 93.3 /100 | #121 | Exceptional 67.3% |
| Immigrants | Jordan | 92.8 /100 | #122 | Exceptional 67.3% |
| Immigrants | Northern Africa | 92.7 /100 | #123 | Exceptional 67.2% |
| Arabs | 92.6 /100 | #124 | Exceptional 67.2% |
| Italians | 91.8 /100 | #125 | Exceptional 67.2% |
| Alsatians | 91.3 /100 | #126 | Exceptional 67.1% |
| Czechs | 90.8 /100 | #127 | Exceptional 67.1% |
| Scottish | 90.2 /100 | #128 | Exceptional 67.0% |
| Immigrants | Eastern Africa | 89.5 /100 | #129 | Excellent 67.0% |
| Immigrants | Syria | 89.0 /100 | #130 | Excellent 66.9% |
| Finns | 88.6 /100 | #131 | Excellent 66.9% |