Cajun vs Slavic Ambulatory Disability
COMPARE
Cajun
Slavic
Ambulatory Disability
Ambulatory Disability Comparison
Cajuns
Slavs
7.8%
AMBULATORY DISABILITY
0.0/ 100
METRIC RATING
331st/ 347
METRIC RANK
6.4%
AMBULATORY DISABILITY
5.1/ 100
METRIC RATING
226th/ 347
METRIC RANK
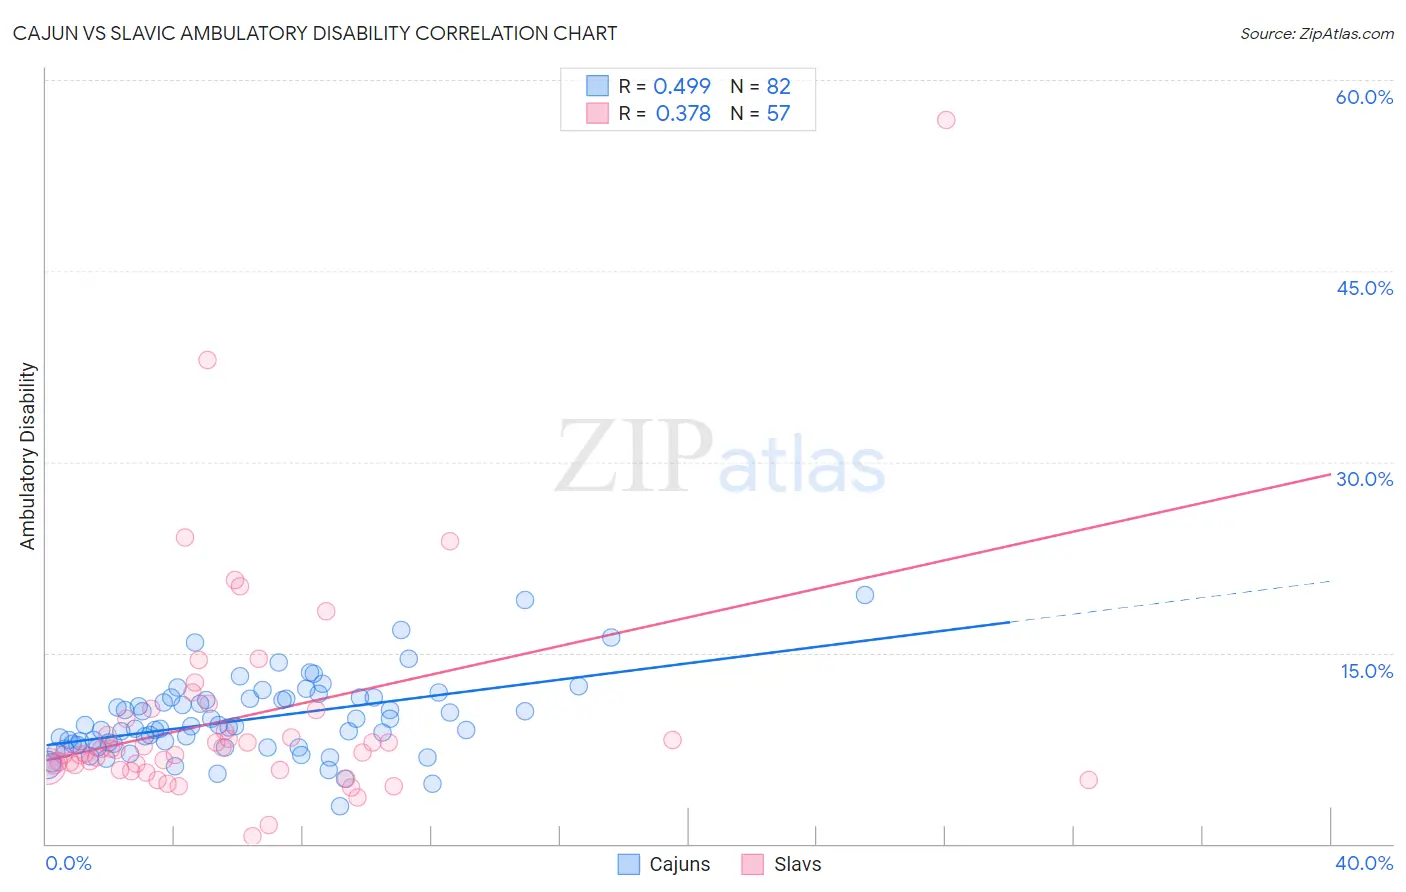
Cajun vs Slavic Ambulatory Disability Correlation Chart
The statistical analysis conducted on geographies consisting of 149,692,949 people shows a moderate positive correlation between the proportion of Cajuns and percentage of population with ambulatory disability in the United States with a correlation coefficient (R) of 0.499 and weighted average of 7.8%. Similarly, the statistical analysis conducted on geographies consisting of 270,841,437 people shows a mild positive correlation between the proportion of Slavs and percentage of population with ambulatory disability in the United States with a correlation coefficient (R) of 0.378 and weighted average of 6.4%, a difference of 22.5%.
Ambulatory Disability Correlation Summary
| Measurement | Cajun | Slavic |
| Minimum | 2.9% | 0.58% |
| Maximum | 19.6% | 56.8% |
| Range | 16.7% | 56.3% |
| Mean | 9.8% | 9.9% |
| Median | 9.2% | 7.4% |
| Interquartile 25% (IQ1) | 7.7% | 6.0% |
| Interquartile 75% (IQ3) | 11.4% | 10.2% |
| Interquartile Range (IQR) | 3.7% | 4.2% |
| Standard Deviation (Sample) | 3.0% | 8.9% |
| Standard Deviation (Population) | 3.0% | 8.8% |
Similar Demographics by Ambulatory Disability
Demographics Similar to Cajuns by Ambulatory Disability
In terms of ambulatory disability, the demographic groups most similar to Cajuns are Menominee (7.8%, a difference of 0.28%), Cherokee (7.9%, a difference of 1.2%), Paiute (7.7%, a difference of 1.2%), Yuman (7.9%, a difference of 2.1%), and Pueblo (7.6%, a difference of 2.5%).
| Demographics | Rating | Rank | Ambulatory Disability |
| Navajo | 0.0 /100 | #324 | Tragic 7.5% |
| Comanche | 0.0 /100 | #325 | Tragic 7.5% |
| Blacks/African Americans | 0.0 /100 | #326 | Tragic 7.5% |
| Natives/Alaskans | 0.0 /100 | #327 | Tragic 7.5% |
| Hopi | 0.0 /100 | #328 | Tragic 7.6% |
| Pueblo | 0.0 /100 | #329 | Tragic 7.6% |
| Paiute | 0.0 /100 | #330 | Tragic 7.7% |
| Cajuns | 0.0 /100 | #331 | Tragic 7.8% |
| Menominee | 0.0 /100 | #332 | Tragic 7.8% |
| Cherokee | 0.0 /100 | #333 | Tragic 7.9% |
| Yuman | 0.0 /100 | #334 | Tragic 7.9% |
| Chickasaw | 0.0 /100 | #335 | Tragic 8.0% |
| Seminole | 0.0 /100 | #336 | Tragic 8.0% |
| Dutch West Indians | 0.0 /100 | #337 | Tragic 8.2% |
| Colville | 0.0 /100 | #338 | Tragic 8.2% |
Demographics Similar to Slavs by Ambulatory Disability
In terms of ambulatory disability, the demographic groups most similar to Slavs are Honduran (6.3%, a difference of 0.27%), Cuban (6.4%, a difference of 0.33%), Portuguese (6.4%, a difference of 0.34%), Czechoslovakian (6.4%, a difference of 0.39%), and Liberian (6.3%, a difference of 0.44%).
| Demographics | Rating | Rank | Ambulatory Disability |
| Indonesians | 9.9 /100 | #219 | Tragic 6.3% |
| Immigrants | Albania | 9.6 /100 | #220 | Tragic 6.3% |
| Hungarians | 9.6 /100 | #221 | Tragic 6.3% |
| German Russians | 9.4 /100 | #222 | Tragic 6.3% |
| Immigrants | Honduras | 7.6 /100 | #223 | Tragic 6.3% |
| Liberians | 7.1 /100 | #224 | Tragic 6.3% |
| Hondurans | 6.3 /100 | #225 | Tragic 6.3% |
| Slavs | 5.1 /100 | #226 | Tragic 6.4% |
| Cubans | 4.0 /100 | #227 | Tragic 6.4% |
| Portuguese | 4.0 /100 | #228 | Tragic 6.4% |
| Czechoslovakians | 3.8 /100 | #229 | Tragic 6.4% |
| Mexicans | 3.5 /100 | #230 | Tragic 6.4% |
| Panamanians | 3.1 /100 | #231 | Tragic 6.4% |
| Assyrians/Chaldeans/Syriacs | 2.4 /100 | #232 | Tragic 6.4% |
| Sub-Saharan Africans | 2.3 /100 | #233 | Tragic 6.4% |