Cajun vs Immigrants from South Africa College, Under 1 year
COMPARE
Cajun
Immigrants from South Africa
College, Under 1 year
College, Under 1 year Comparison
Cajuns
Immigrants from South Africa
57.3%
COLLEGE, UNDER 1 YEAR
0.0/ 100
METRIC RATING
311th/ 347
METRIC RANK
70.6%
COLLEGE, UNDER 1 YEAR
99.9/ 100
METRIC RATING
33rd/ 347
METRIC RANK
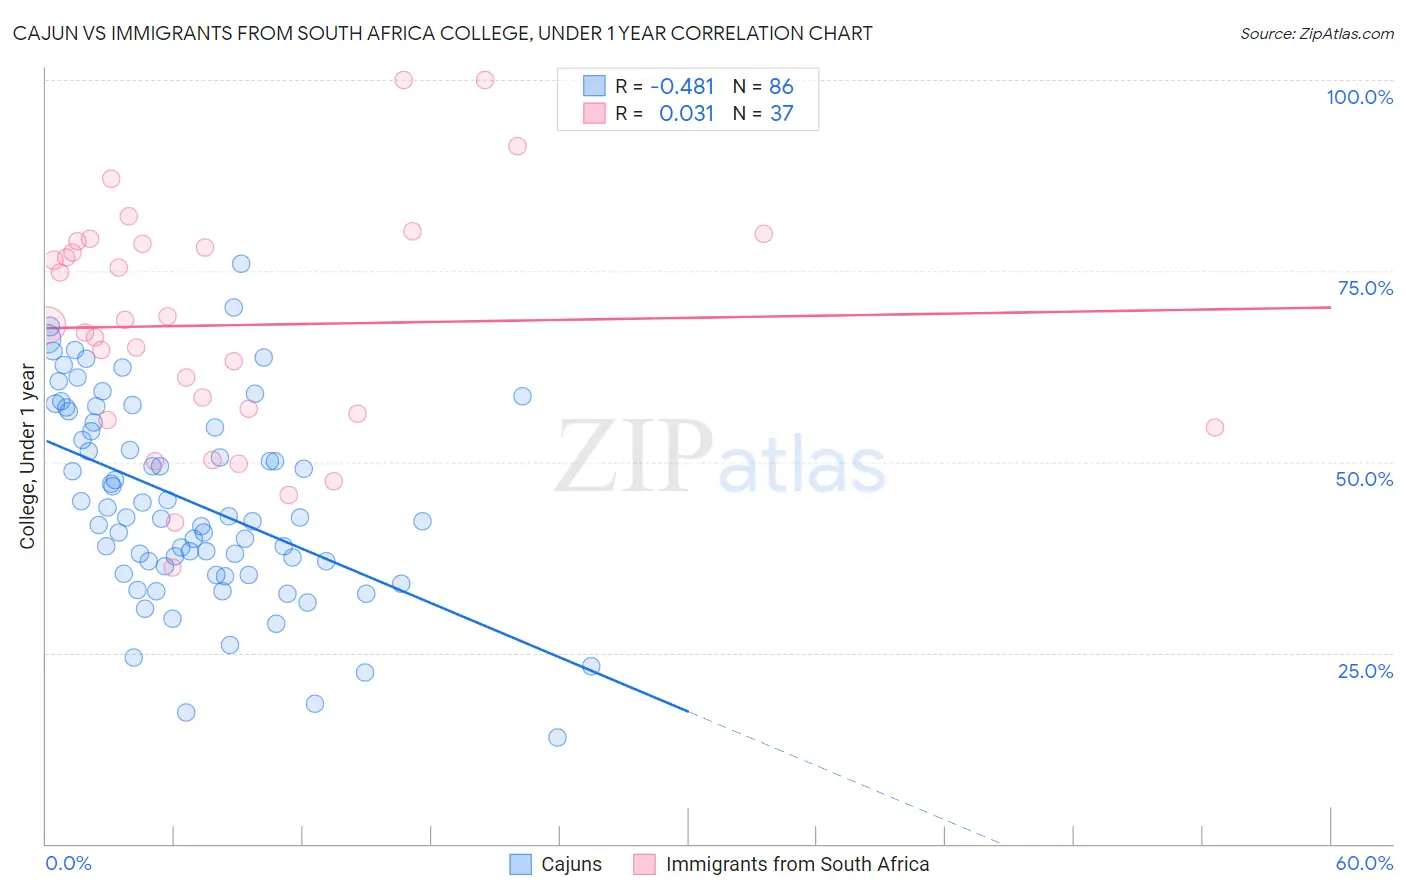
Cajun vs Immigrants from South Africa College, Under 1 year Correlation Chart
The statistical analysis conducted on geographies consisting of 149,713,149 people shows a moderate negative correlation between the proportion of Cajuns and percentage of population with at least college, under 1 year education in the United States with a correlation coefficient (R) of -0.481 and weighted average of 57.3%. Similarly, the statistical analysis conducted on geographies consisting of 233,321,300 people shows no correlation between the proportion of Immigrants from South Africa and percentage of population with at least college, under 1 year education in the United States with a correlation coefficient (R) of 0.031 and weighted average of 70.6%, a difference of 23.1%.
College, Under 1 year Correlation Summary
| Measurement | Cajun | Immigrants from South Africa |
| Minimum | 13.9% | 36.2% |
| Maximum | 75.9% | 100.0% |
| Range | 62.0% | 63.8% |
| Mean | 44.8% | 67.9% |
| Median | 42.7% | 68.0% |
| Interquartile 25% (IQ1) | 36.3% | 56.0% |
| Interquartile 75% (IQ3) | 55.2% | 78.7% |
| Interquartile Range (IQR) | 18.9% | 22.8% |
| Standard Deviation (Sample) | 13.0% | 15.4% |
| Standard Deviation (Population) | 12.9% | 15.2% |
Similar Demographics by College, Under 1 year
Demographics Similar to Cajuns by College, Under 1 year
In terms of college, under 1 year, the demographic groups most similar to Cajuns are Pueblo (57.4%, a difference of 0.060%), Salvadoran (57.3%, a difference of 0.070%), Dutch West Indian (57.2%, a difference of 0.31%), Hopi (57.1%, a difference of 0.42%), and Immigrants from Nicaragua (57.6%, a difference of 0.45%).
| Demographics | Rating | Rank | College, Under 1 year |
| Kiowa | 0.0 /100 | #304 | Tragic 57.8% |
| Haitians | 0.0 /100 | #305 | Tragic 57.8% |
| Immigrants | Portugal | 0.0 /100 | #306 | Tragic 57.7% |
| Fijians | 0.0 /100 | #307 | Tragic 57.7% |
| Central Americans | 0.0 /100 | #308 | Tragic 57.7% |
| Immigrants | Nicaragua | 0.0 /100 | #309 | Tragic 57.6% |
| Pueblo | 0.0 /100 | #310 | Tragic 57.4% |
| Cajuns | 0.0 /100 | #311 | Tragic 57.3% |
| Salvadorans | 0.0 /100 | #312 | Tragic 57.3% |
| Dutch West Indians | 0.0 /100 | #313 | Tragic 57.2% |
| Hopi | 0.0 /100 | #314 | Tragic 57.1% |
| Hondurans | 0.0 /100 | #315 | Tragic 57.1% |
| Menominee | 0.0 /100 | #316 | Tragic 57.0% |
| Hispanics or Latinos | 0.0 /100 | #317 | Tragic 57.0% |
| Immigrants | Haiti | 0.0 /100 | #318 | Tragic 56.9% |
Demographics Similar to Immigrants from South Africa by College, Under 1 year
In terms of college, under 1 year, the demographic groups most similar to Immigrants from South Africa are Estonian (70.6%, a difference of 0.020%), Russian (70.5%, a difference of 0.10%), Immigrants from Sri Lanka (70.5%, a difference of 0.16%), Turkish (70.7%, a difference of 0.17%), and Indian (Asian) (70.8%, a difference of 0.25%).
| Demographics | Rating | Rank | College, Under 1 year |
| Immigrants | Denmark | 100.0 /100 | #26 | Exceptional 71.0% |
| Immigrants | Ireland | 100.0 /100 | #27 | Exceptional 71.0% |
| Immigrants | Hong Kong | 100.0 /100 | #28 | Exceptional 71.0% |
| Immigrants | France | 100.0 /100 | #29 | Exceptional 71.0% |
| Immigrants | China | 99.9 /100 | #30 | Exceptional 70.9% |
| Indians (Asian) | 99.9 /100 | #31 | Exceptional 70.8% |
| Turks | 99.9 /100 | #32 | Exceptional 70.7% |
| Immigrants | South Africa | 99.9 /100 | #33 | Exceptional 70.6% |
| Estonians | 99.9 /100 | #34 | Exceptional 70.6% |
| Russians | 99.9 /100 | #35 | Exceptional 70.5% |
| Immigrants | Sri Lanka | 99.9 /100 | #36 | Exceptional 70.5% |
| Immigrants | Saudi Arabia | 99.9 /100 | #37 | Exceptional 70.4% |
| Australians | 99.9 /100 | #38 | Exceptional 70.4% |
| Bhutanese | 99.9 /100 | #39 | Exceptional 70.3% |
| Immigrants | Turkey | 99.9 /100 | #40 | Exceptional 70.3% |