British vs Jordanian College, 1 year or more
COMPARE
British
Jordanian
College, 1 year or more
College, 1 year or more Comparison
British
Jordanians
62.3%
COLLEGE, 1 YEAR OR MORE
97.4/ 100
METRIC RATING
95th/ 347
METRIC RANK
62.2%
COLLEGE, 1 YEAR OR MORE
97.2/ 100
METRIC RATING
97th/ 347
METRIC RANK
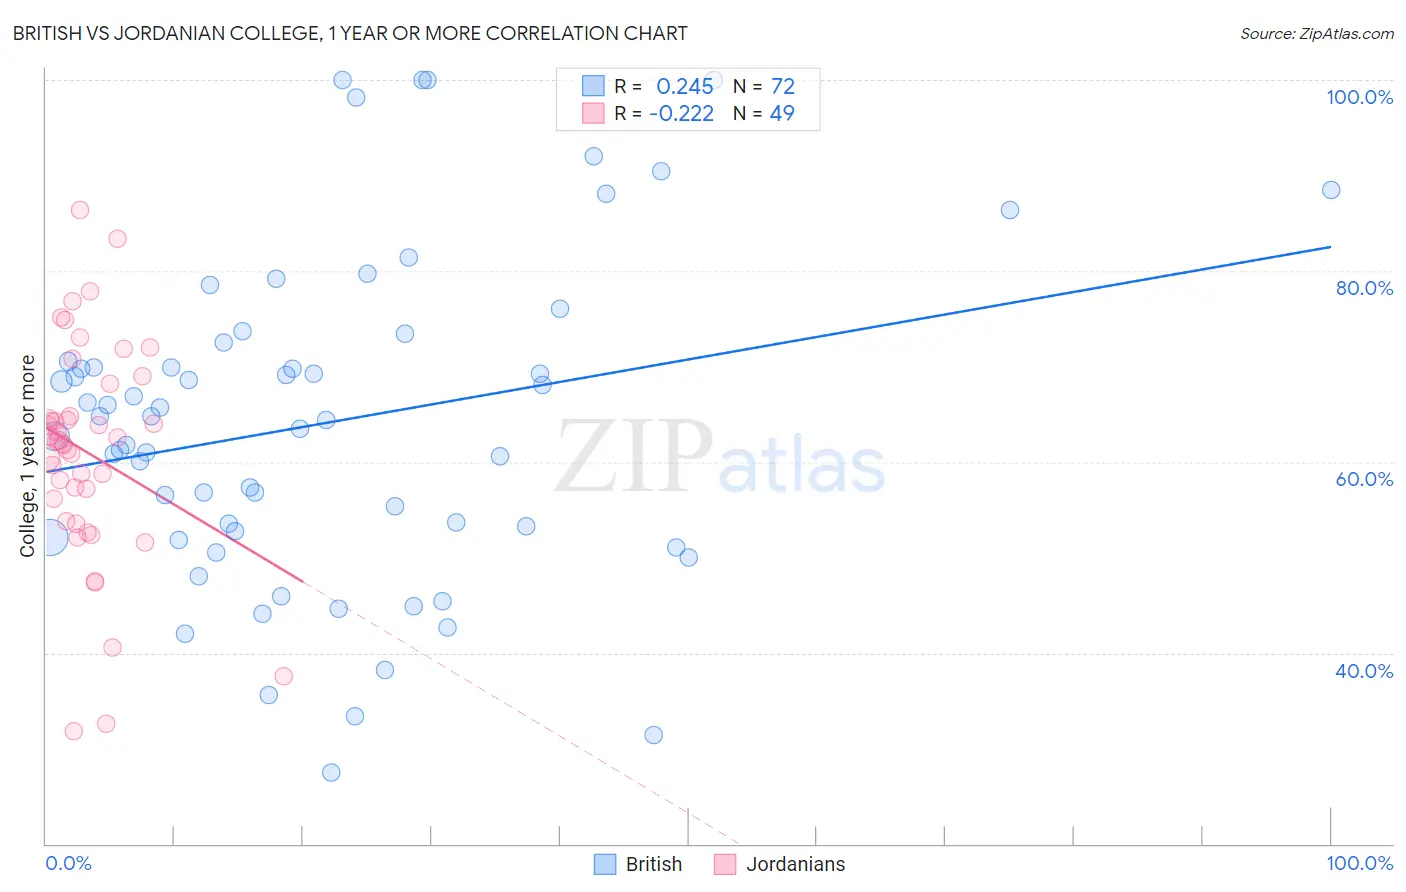
British vs Jordanian College, 1 year or more Correlation Chart
The statistical analysis conducted on geographies consisting of 531,458,915 people shows a weak positive correlation between the proportion of British and percentage of population with at least college, 1 year or more education in the United States with a correlation coefficient (R) of 0.245 and weighted average of 62.3%. Similarly, the statistical analysis conducted on geographies consisting of 166,424,117 people shows a weak negative correlation between the proportion of Jordanians and percentage of population with at least college, 1 year or more education in the United States with a correlation coefficient (R) of -0.222 and weighted average of 62.2%, a difference of 0.12%.
College, 1 year or more Correlation Summary
| Measurement | British | Jordanian |
| Minimum | 27.5% | 31.8% |
| Maximum | 100.0% | 86.4% |
| Range | 72.5% | 54.6% |
| Mean | 64.1% | 61.0% |
| Median | 64.6% | 62.1% |
| Interquartile 25% (IQ1) | 52.5% | 55.0% |
| Interquartile 75% (IQ3) | 71.5% | 66.5% |
| Interquartile Range (IQR) | 19.0% | 11.5% |
| Standard Deviation (Sample) | 17.1% | 11.4% |
| Standard Deviation (Population) | 17.0% | 11.3% |
Demographics Similar to British and Jordanians by College, 1 year or more
In terms of college, 1 year or more, the demographic groups most similar to British are Immigrants from Croatia (62.3%, a difference of 0.10%), Chinese (62.2%, a difference of 0.12%), Carpatho Rusyn (62.2%, a difference of 0.12%), Croatian (62.2%, a difference of 0.13%), and Romanian (62.4%, a difference of 0.16%). Similarly, the demographic groups most similar to Jordanians are Carpatho Rusyn (62.2%, a difference of 0.0%), Chinese (62.2%, a difference of 0.010%), Croatian (62.2%, a difference of 0.010%), Icelander (62.1%, a difference of 0.17%), and Swedish (62.1%, a difference of 0.17%).
| Demographics | Rating | Rank | College, 1 year or more |
| Immigrants | Western Europe | 98.6 /100 | #86 | Exceptional 62.7% |
| Immigrants | Hungary | 98.6 /100 | #87 | Exceptional 62.7% |
| Greeks | 98.3 /100 | #88 | Exceptional 62.6% |
| Immigrants | Ethiopia | 98.2 /100 | #89 | Exceptional 62.6% |
| Immigrants | Western Asia | 97.9 /100 | #90 | Exceptional 62.5% |
| Immigrants | Eastern Europe | 97.8 /100 | #91 | Exceptional 62.4% |
| Immigrants | Egypt | 97.8 /100 | #92 | Exceptional 62.4% |
| Romanians | 97.7 /100 | #93 | Exceptional 62.4% |
| Immigrants | Croatia | 97.6 /100 | #94 | Exceptional 62.3% |
| British | 97.4 /100 | #95 | Exceptional 62.3% |
| Chinese | 97.2 /100 | #96 | Exceptional 62.2% |
| Jordanians | 97.2 /100 | #97 | Exceptional 62.2% |
| Carpatho Rusyns | 97.2 /100 | #98 | Exceptional 62.2% |
| Croatians | 97.1 /100 | #99 | Exceptional 62.2% |
| Icelanders | 96.8 /100 | #100 | Exceptional 62.1% |
| Swedes | 96.8 /100 | #101 | Exceptional 62.1% |
| Luxembourgers | 96.7 /100 | #102 | Exceptional 62.1% |
| Afghans | 96.4 /100 | #103 | Exceptional 62.0% |
| Chileans | 96.4 /100 | #104 | Exceptional 62.0% |
| Immigrants | Nepal | 96.3 /100 | #105 | Exceptional 62.0% |
| Palestinians | 96.3 /100 | #106 | Exceptional 62.0% |