Immigrants from Asia vs Tlingit-Haida College, 1 year or more
COMPARE
Immigrants from Asia
Tlingit-Haida
College, 1 year or more
College, 1 year or more Comparison
Immigrants from Asia
Tlingit-Haida
64.0%
COLLEGE, 1 YEAR OR MORE
99.7/ 100
METRIC RATING
58th/ 347
METRIC RANK
59.4%
COLLEGE, 1 YEAR OR MORE
48.4/ 100
METRIC RATING
177th/ 347
METRIC RANK
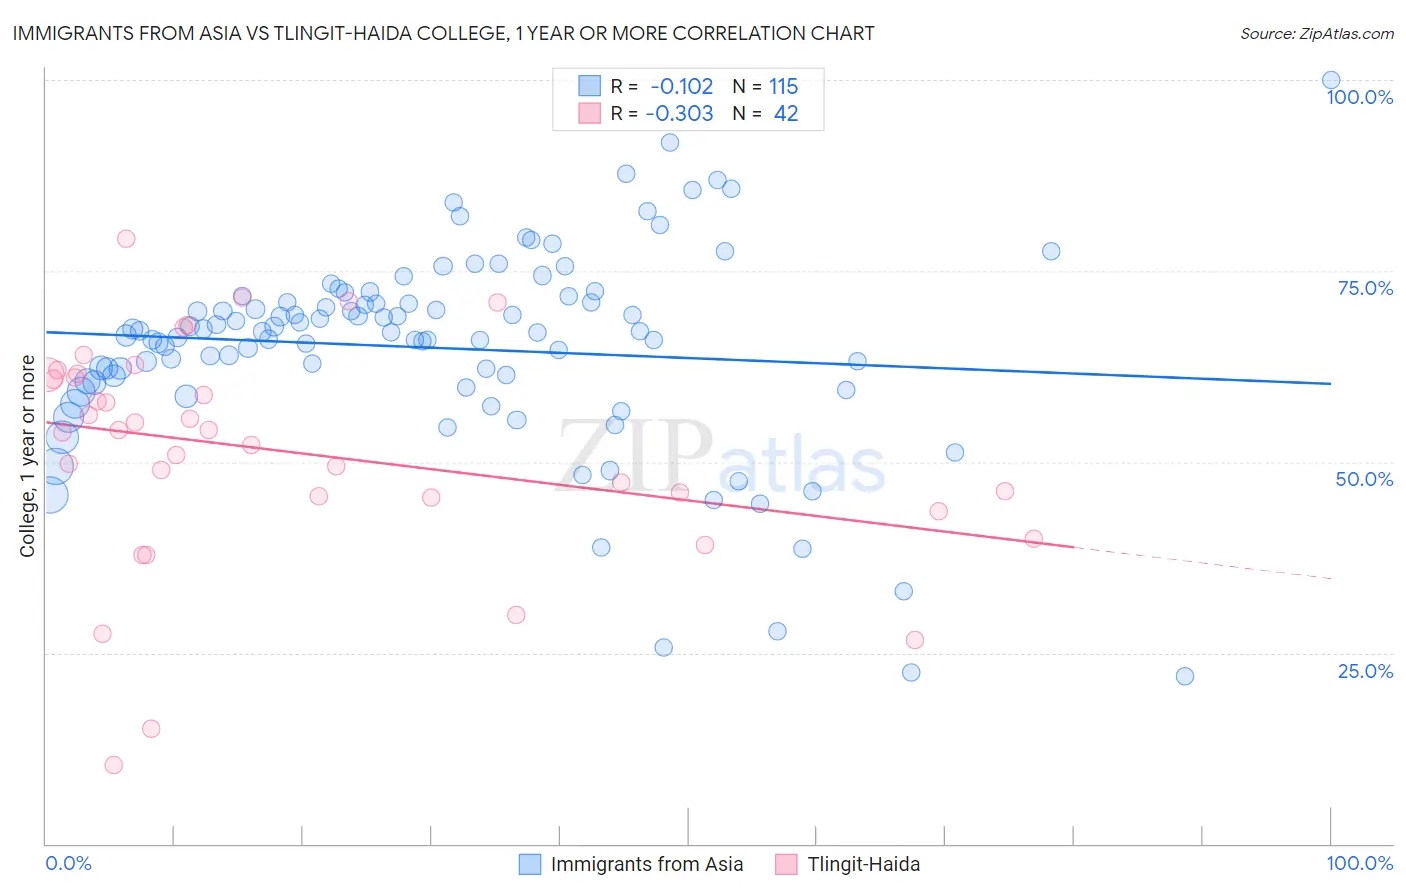
Immigrants from Asia vs Tlingit-Haida College, 1 year or more Correlation Chart
The statistical analysis conducted on geographies consisting of 549,164,299 people shows a poor negative correlation between the proportion of Immigrants from Asia and percentage of population with at least college, 1 year or more education in the United States with a correlation coefficient (R) of -0.102 and weighted average of 64.0%. Similarly, the statistical analysis conducted on geographies consisting of 60,872,339 people shows a mild negative correlation between the proportion of Tlingit-Haida and percentage of population with at least college, 1 year or more education in the United States with a correlation coefficient (R) of -0.303 and weighted average of 59.4%, a difference of 7.8%.
College, 1 year or more Correlation Summary
| Measurement | Immigrants from Asia | Tlingit-Haida |
| Minimum | 22.0% | 10.3% |
| Maximum | 100.0% | 79.3% |
| Range | 78.0% | 69.0% |
| Mean | 64.9% | 51.3% |
| Median | 67.0% | 54.0% |
| Interquartile 25% (IQ1) | 60.3% | 45.3% |
| Interquartile 75% (IQ3) | 70.9% | 61.5% |
| Interquartile Range (IQR) | 10.6% | 16.1% |
| Standard Deviation (Sample) | 13.3% | 14.8% |
| Standard Deviation (Population) | 13.3% | 14.6% |
Similar Demographics by College, 1 year or more
Demographics Similar to Immigrants from Asia by College, 1 year or more
In terms of college, 1 year or more, the demographic groups most similar to Immigrants from Asia are South African (64.1%, a difference of 0.14%), Immigrants from Czechoslovakia (64.1%, a difference of 0.15%), Immigrants from Belarus (64.1%, a difference of 0.18%), Zimbabwean (64.2%, a difference of 0.30%), and Asian (64.2%, a difference of 0.33%).
| Demographics | Rating | Rank | College, 1 year or more |
| Immigrants | Malaysia | 99.8 /100 | #51 | Exceptional 64.3% |
| Immigrants | Netherlands | 99.8 /100 | #52 | Exceptional 64.2% |
| Asians | 99.8 /100 | #53 | Exceptional 64.2% |
| Zimbabweans | 99.8 /100 | #54 | Exceptional 64.2% |
| Immigrants | Belarus | 99.7 /100 | #55 | Exceptional 64.1% |
| Immigrants | Czechoslovakia | 99.7 /100 | #56 | Exceptional 64.1% |
| South Africans | 99.7 /100 | #57 | Exceptional 64.1% |
| Immigrants | Asia | 99.7 /100 | #58 | Exceptional 64.0% |
| Immigrants | Serbia | 99.6 /100 | #59 | Exceptional 63.8% |
| Immigrants | Kazakhstan | 99.5 /100 | #60 | Exceptional 63.6% |
| Bolivians | 99.5 /100 | #61 | Exceptional 63.5% |
| Immigrants | Indonesia | 99.5 /100 | #62 | Exceptional 63.5% |
| Immigrants | Scotland | 99.4 /100 | #63 | Exceptional 63.4% |
| Immigrants | Spain | 99.4 /100 | #64 | Exceptional 63.4% |
| Maltese | 99.3 /100 | #65 | Exceptional 63.4% |
Demographics Similar to Tlingit-Haida by College, 1 year or more
In terms of college, 1 year or more, the demographic groups most similar to Tlingit-Haida are Czechoslovakian (59.4%, a difference of 0.0%), Sri Lankan (59.4%, a difference of 0.030%), Immigrants from Poland (59.4%, a difference of 0.030%), Celtic (59.4%, a difference of 0.080%), and Bermudan (59.3%, a difference of 0.10%).
| Demographics | Rating | Rank | College, 1 year or more |
| Welsh | 52.4 /100 | #170 | Average 59.5% |
| Immigrants | Albania | 52.3 /100 | #171 | Average 59.5% |
| Immigrants | Sierra Leone | 52.2 /100 | #172 | Average 59.5% |
| Immigrants | Oceania | 51.2 /100 | #173 | Average 59.4% |
| Celtics | 50.0 /100 | #174 | Average 59.4% |
| Sri Lankans | 49.0 /100 | #175 | Average 59.4% |
| Immigrants | Poland | 48.9 /100 | #176 | Average 59.4% |
| Tlingit-Haida | 48.4 /100 | #177 | Average 59.4% |
| Czechoslovakians | 48.3 /100 | #178 | Average 59.4% |
| Bermudans | 46.6 /100 | #179 | Average 59.3% |
| Yugoslavians | 44.1 /100 | #180 | Average 59.2% |
| Swiss | 43.4 /100 | #181 | Average 59.2% |
| Immigrants | Bosnia and Herzegovina | 42.8 /100 | #182 | Average 59.2% |
| German Russians | 39.3 /100 | #183 | Fair 59.1% |
| Spaniards | 38.3 /100 | #184 | Fair 59.0% |