Sioux vs Tlingit-Haida College, 1 year or more
COMPARE
Sioux
Tlingit-Haida
College, 1 year or more
College, 1 year or more Comparison
Sioux
Tlingit-Haida
53.0%
COLLEGE, 1 YEAR OR MORE
0.0/ 100
METRIC RATING
296th/ 347
METRIC RANK
59.4%
COLLEGE, 1 YEAR OR MORE
48.4/ 100
METRIC RATING
177th/ 347
METRIC RANK
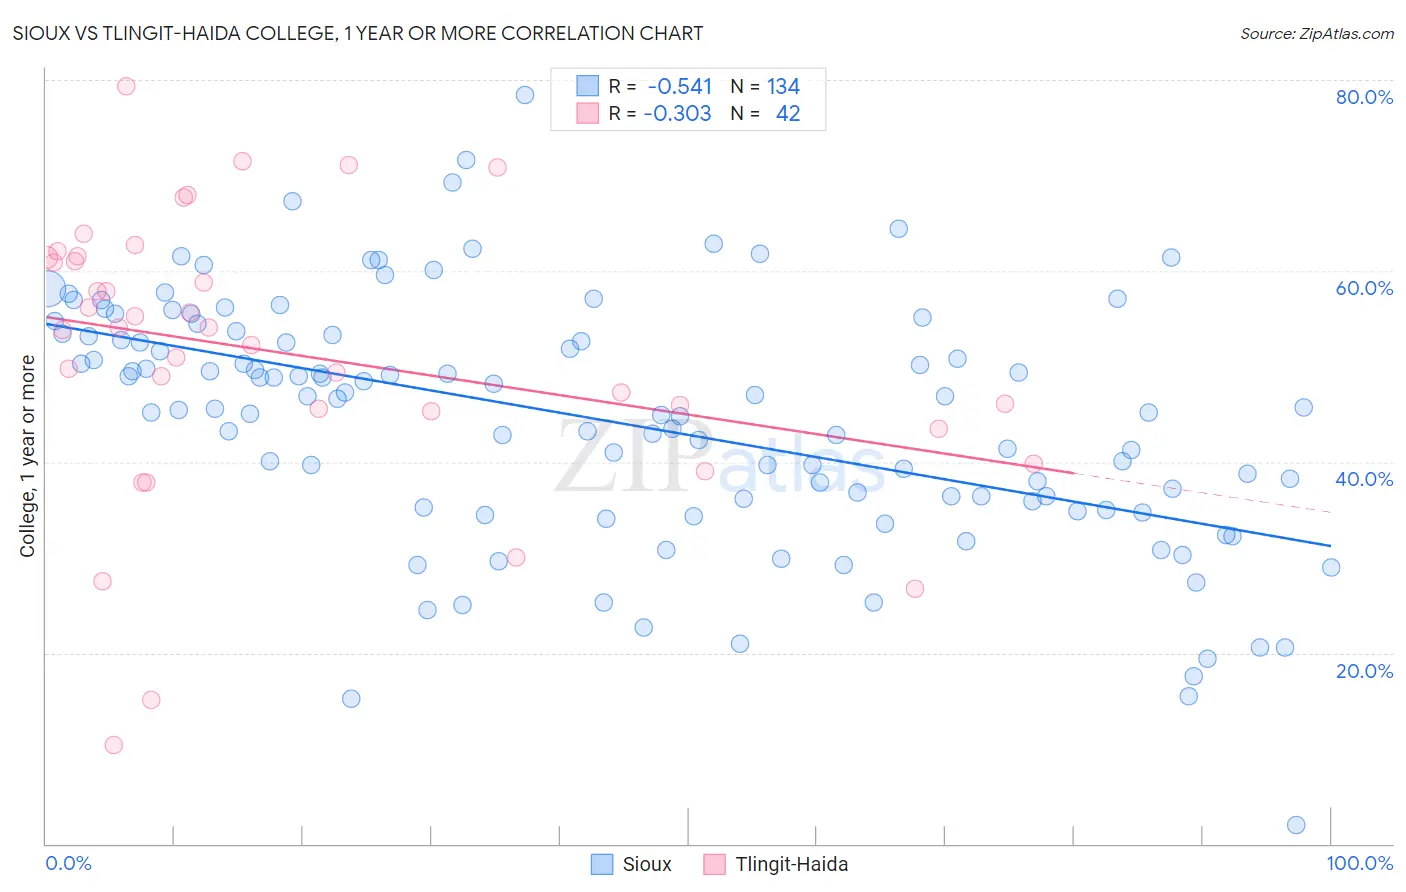
Sioux vs Tlingit-Haida College, 1 year or more Correlation Chart
The statistical analysis conducted on geographies consisting of 234,199,467 people shows a substantial negative correlation between the proportion of Sioux and percentage of population with at least college, 1 year or more education in the United States with a correlation coefficient (R) of -0.541 and weighted average of 53.0%. Similarly, the statistical analysis conducted on geographies consisting of 60,872,339 people shows a mild negative correlation between the proportion of Tlingit-Haida and percentage of population with at least college, 1 year or more education in the United States with a correlation coefficient (R) of -0.303 and weighted average of 59.4%, a difference of 12.0%.
College, 1 year or more Correlation Summary
| Measurement | Sioux | Tlingit-Haida |
| Minimum | 2.0% | 10.3% |
| Maximum | 78.4% | 79.3% |
| Range | 76.4% | 69.0% |
| Mean | 44.3% | 51.3% |
| Median | 45.6% | 54.0% |
| Interquartile 25% (IQ1) | 35.8% | 45.3% |
| Interquartile 75% (IQ3) | 53.3% | 61.5% |
| Interquartile Range (IQR) | 17.5% | 16.1% |
| Standard Deviation (Sample) | 13.0% | 14.8% |
| Standard Deviation (Population) | 12.9% | 14.6% |
Similar Demographics by College, 1 year or more
Demographics Similar to Sioux by College, 1 year or more
In terms of college, 1 year or more, the demographic groups most similar to Sioux are Paiute (52.9%, a difference of 0.28%), Yaqui (53.2%, a difference of 0.34%), Cherokee (53.2%, a difference of 0.35%), Black/African American (53.3%, a difference of 0.56%), and Chickasaw (53.3%, a difference of 0.58%).
| Demographics | Rating | Rank | College, 1 year or more |
| Immigrants | Ecuador | 0.0 /100 | #289 | Tragic 53.4% |
| Alaskan Athabascans | 0.0 /100 | #290 | Tragic 53.4% |
| Cubans | 0.0 /100 | #291 | Tragic 53.4% |
| Chickasaw | 0.0 /100 | #292 | Tragic 53.3% |
| Blacks/African Americans | 0.0 /100 | #293 | Tragic 53.3% |
| Cherokee | 0.0 /100 | #294 | Tragic 53.2% |
| Yaqui | 0.0 /100 | #295 | Tragic 53.2% |
| Sioux | 0.0 /100 | #296 | Tragic 53.0% |
| Paiute | 0.0 /100 | #297 | Tragic 52.9% |
| Immigrants | Dominica | 0.0 /100 | #298 | Tragic 52.5% |
| Immigrants | Nicaragua | 0.0 /100 | #299 | Tragic 52.4% |
| Choctaw | 0.0 /100 | #300 | Tragic 52.3% |
| Haitians | 0.0 /100 | #301 | Tragic 52.3% |
| Puerto Ricans | 0.0 /100 | #302 | Tragic 52.2% |
| Creek | 0.0 /100 | #303 | Tragic 52.2% |
Demographics Similar to Tlingit-Haida by College, 1 year or more
In terms of college, 1 year or more, the demographic groups most similar to Tlingit-Haida are Czechoslovakian (59.4%, a difference of 0.0%), Sri Lankan (59.4%, a difference of 0.030%), Immigrants from Poland (59.4%, a difference of 0.030%), Celtic (59.4%, a difference of 0.080%), and Bermudan (59.3%, a difference of 0.10%).
| Demographics | Rating | Rank | College, 1 year or more |
| Welsh | 52.4 /100 | #170 | Average 59.5% |
| Immigrants | Albania | 52.3 /100 | #171 | Average 59.5% |
| Immigrants | Sierra Leone | 52.2 /100 | #172 | Average 59.5% |
| Immigrants | Oceania | 51.2 /100 | #173 | Average 59.4% |
| Celtics | 50.0 /100 | #174 | Average 59.4% |
| Sri Lankans | 49.0 /100 | #175 | Average 59.4% |
| Immigrants | Poland | 48.9 /100 | #176 | Average 59.4% |
| Tlingit-Haida | 48.4 /100 | #177 | Average 59.4% |
| Czechoslovakians | 48.3 /100 | #178 | Average 59.4% |
| Bermudans | 46.6 /100 | #179 | Average 59.3% |
| Yugoslavians | 44.1 /100 | #180 | Average 59.2% |
| Swiss | 43.4 /100 | #181 | Average 59.2% |
| Immigrants | Bosnia and Herzegovina | 42.8 /100 | #182 | Average 59.2% |
| German Russians | 39.3 /100 | #183 | Fair 59.1% |
| Spaniards | 38.3 /100 | #184 | Fair 59.0% |