Black/African American vs Immigrants from Nigeria Currently Married
COMPARE
Black/African American
Immigrants from Nigeria
Currently Married
Currently Married Comparison
Blacks/African Americans
Immigrants from Nigeria
39.6%
CURRENTLY MARRIED
0.0/ 100
METRIC RATING
337th/ 347
METRIC RANK
43.4%
CURRENTLY MARRIED
0.1/ 100
METRIC RATING
277th/ 347
METRIC RANK
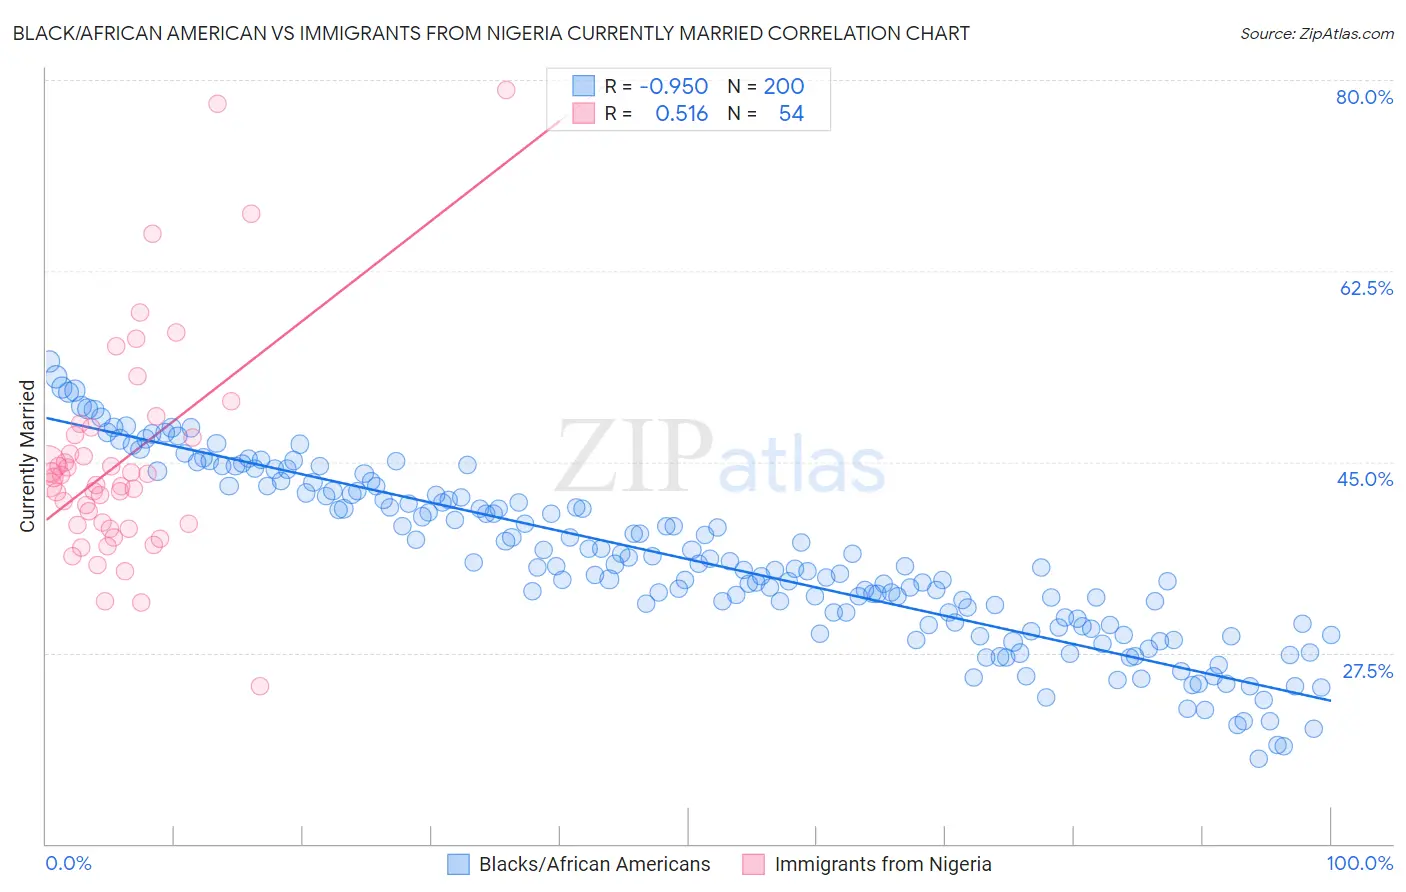
Black/African American vs Immigrants from Nigeria Currently Married Correlation Chart
The statistical analysis conducted on geographies consisting of 565,898,128 people shows a near-perfect negative correlation between the proportion of Blacks/African Americans and percentage of population currently married in the United States with a correlation coefficient (R) of -0.950 and weighted average of 39.6%. Similarly, the statistical analysis conducted on geographies consisting of 283,441,157 people shows a substantial positive correlation between the proportion of Immigrants from Nigeria and percentage of population currently married in the United States with a correlation coefficient (R) of 0.516 and weighted average of 43.4%, a difference of 9.6%.
Currently Married Correlation Summary
| Measurement | Black/African American | Immigrants from Nigeria |
| Minimum | 17.8% | 24.4% |
| Maximum | 54.2% | 79.1% |
| Range | 36.4% | 54.7% |
| Mean | 36.1% | 45.1% |
| Median | 35.4% | 43.2% |
| Interquartile 25% (IQ1) | 30.1% | 39.2% |
| Interquartile 75% (IQ3) | 42.1% | 47.4% |
| Interquartile Range (IQR) | 12.0% | 8.3% |
| Standard Deviation (Sample) | 7.9% | 10.2% |
| Standard Deviation (Population) | 7.9% | 10.1% |
Similar Demographics by Currently Married
Demographics Similar to Blacks/African Americans by Currently Married
In terms of currently married, the demographic groups most similar to Blacks/African Americans are Cape Verdean (39.6%, a difference of 0.090%), Dominican (39.5%, a difference of 0.25%), British West Indian (39.8%, a difference of 0.38%), Lumbee (39.8%, a difference of 0.56%), and Puerto Rican (39.9%, a difference of 0.72%).
| Demographics | Rating | Rank | Currently Married |
| Immigrants | Dominica | 0.0 /100 | #330 | Tragic 40.3% |
| Immigrants | Barbados | 0.0 /100 | #331 | Tragic 40.3% |
| Immigrants | St. Vincent and the Grenadines | 0.0 /100 | #332 | Tragic 40.1% |
| Yup'ik | 0.0 /100 | #333 | Tragic 39.9% |
| Puerto Ricans | 0.0 /100 | #334 | Tragic 39.9% |
| Lumbee | 0.0 /100 | #335 | Tragic 39.8% |
| British West Indians | 0.0 /100 | #336 | Tragic 39.8% |
| Blacks/African Americans | 0.0 /100 | #337 | Tragic 39.6% |
| Cape Verdeans | 0.0 /100 | #338 | Tragic 39.6% |
| Dominicans | 0.0 /100 | #339 | Tragic 39.5% |
| Immigrants | Grenada | 0.0 /100 | #340 | Tragic 39.1% |
| Navajo | 0.0 /100 | #341 | Tragic 39.0% |
| Immigrants | Dominican Republic | 0.0 /100 | #342 | Tragic 38.9% |
| Pueblo | 0.0 /100 | #343 | Tragic 38.2% |
| Immigrants | Cabo Verde | 0.0 /100 | #344 | Tragic 37.8% |
Demographics Similar to Immigrants from Nigeria by Currently Married
In terms of currently married, the demographic groups most similar to Immigrants from Nigeria are Sierra Leonean (43.4%, a difference of 0.010%), Colville (43.4%, a difference of 0.040%), Nigerian (43.4%, a difference of 0.060%), Yaqui (43.4%, a difference of 0.070%), and Indonesian (43.5%, a difference of 0.12%).
| Demographics | Rating | Rank | Currently Married |
| Salvadorans | 0.1 /100 | #270 | Tragic 43.5% |
| Bermudans | 0.1 /100 | #271 | Tragic 43.5% |
| Indonesians | 0.1 /100 | #272 | Tragic 43.5% |
| Yaqui | 0.1 /100 | #273 | Tragic 43.4% |
| Nigerians | 0.1 /100 | #274 | Tragic 43.4% |
| Colville | 0.1 /100 | #275 | Tragic 43.4% |
| Sierra Leoneans | 0.1 /100 | #276 | Tragic 43.4% |
| Immigrants | Nigeria | 0.1 /100 | #277 | Tragic 43.4% |
| Central Americans | 0.0 /100 | #278 | Tragic 43.3% |
| Central American Indians | 0.0 /100 | #279 | Tragic 43.3% |
| Apache | 0.0 /100 | #280 | Tragic 43.2% |
| Chippewa | 0.0 /100 | #281 | Tragic 43.2% |
| Immigrants | Ecuador | 0.0 /100 | #282 | Tragic 43.2% |
| Kiowa | 0.0 /100 | #283 | Tragic 43.2% |
| Immigrants | El Salvador | 0.0 /100 | #284 | Tragic 43.1% |