Alsatian vs Bermudan 12th Grade, No Diploma
COMPARE
Alsatian
Bermudan
12th Grade, No Diploma
12th Grade, No Diploma Comparison
Alsatians
Bermudans
91.3%
12TH GRADE, NO DIPLOMA
58.3/ 100
METRIC RATING
165th/ 347
METRIC RANK
91.2%
12TH GRADE, NO DIPLOMA
50.8/ 100
METRIC RATING
172nd/ 347
METRIC RANK
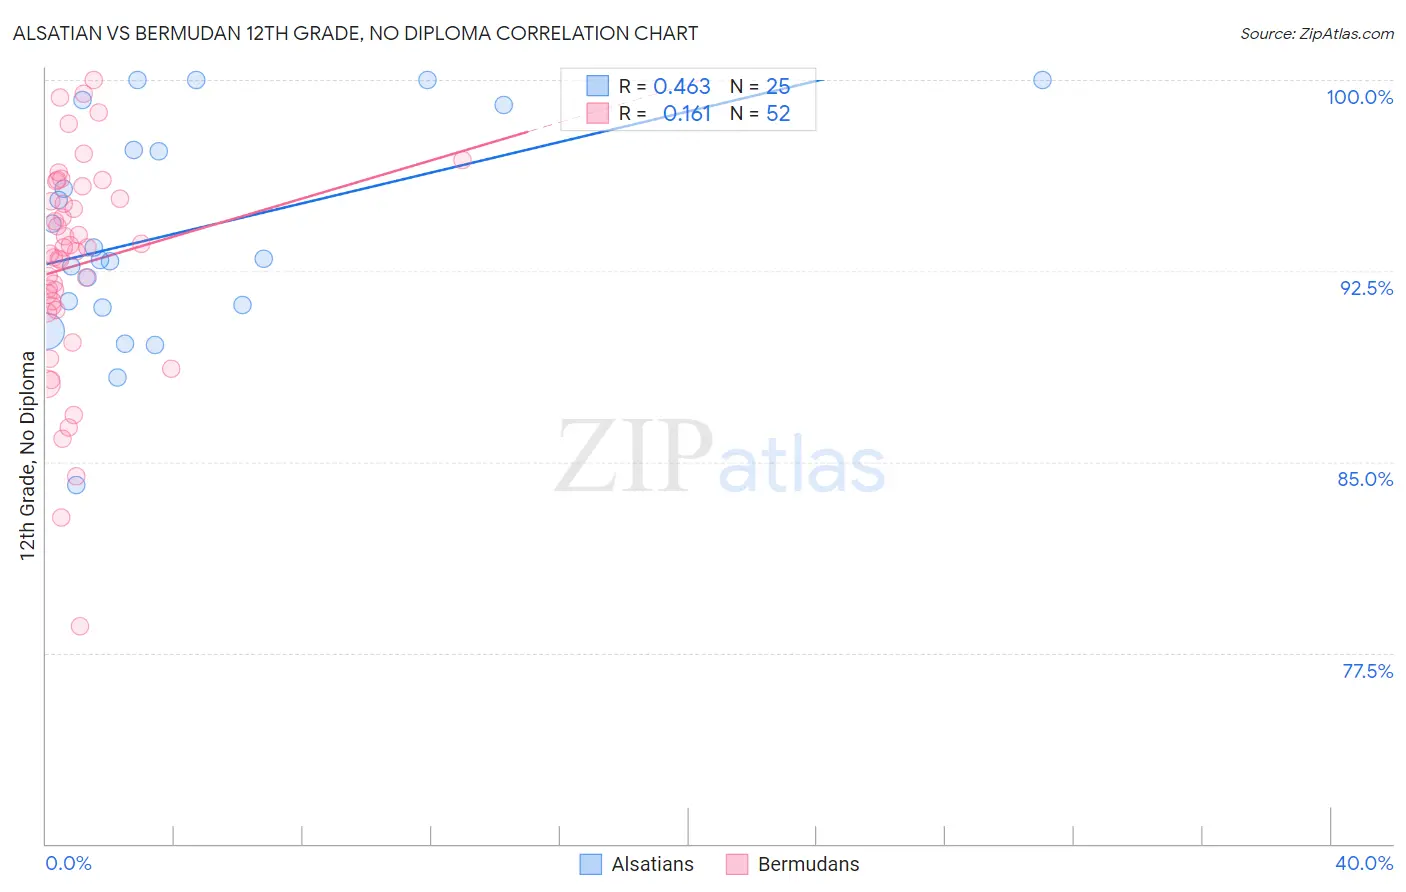
Alsatian vs Bermudan 12th Grade, No Diploma Correlation Chart
The statistical analysis conducted on geographies consisting of 82,682,365 people shows a moderate positive correlation between the proportion of Alsatians and percentage of population with at least 12th grade (no diploma) education in the United States with a correlation coefficient (R) of 0.463 and weighted average of 91.3%. Similarly, the statistical analysis conducted on geographies consisting of 55,730,379 people shows a poor positive correlation between the proportion of Bermudans and percentage of population with at least 12th grade (no diploma) education in the United States with a correlation coefficient (R) of 0.161 and weighted average of 91.2%, a difference of 0.090%.
12th Grade, No Diploma Correlation Summary
| Measurement | Alsatian | Bermudan |
| Minimum | 84.1% | 78.6% |
| Maximum | 100.0% | 100.0% |
| Range | 15.9% | 21.4% |
| Mean | 94.0% | 92.7% |
| Median | 93.0% | 93.4% |
| Interquartile 25% (IQ1) | 91.1% | 91.0% |
| Interquartile 75% (IQ3) | 98.1% | 95.6% |
| Interquartile Range (IQR) | 7.0% | 4.5% |
| Standard Deviation (Sample) | 4.3% | 4.3% |
| Standard Deviation (Population) | 4.2% | 4.2% |
Demographics Similar to Alsatians and Bermudans by 12th Grade, No Diploma
In terms of 12th grade, no diploma, the demographic groups most similar to Alsatians are Hmong (91.3%, a difference of 0.0%), Immigrants from Malaysia (91.3%, a difference of 0.010%), Cree (91.2%, a difference of 0.020%), Immigrants from China (91.3%, a difference of 0.030%), and Immigrants from Asia (91.3%, a difference of 0.040%). Similarly, the demographic groups most similar to Bermudans are Immigrants from Morocco (91.2%, a difference of 0.010%), Bolivian (91.2%, a difference of 0.010%), Immigrants from Nepal (91.2%, a difference of 0.010%), Delaware (91.2%, a difference of 0.020%), and Immigrants from Western Asia (91.2%, a difference of 0.020%).
| Demographics | Rating | Rank | 12th Grade, No Diploma |
| Immigrants | Northern Africa | 66.2 /100 | #158 | Good 91.4% |
| Laotians | 64.4 /100 | #159 | Good 91.3% |
| Immigrants | Albania | 64.1 /100 | #160 | Good 91.3% |
| Immigrants | Hong Kong | 63.8 /100 | #161 | Good 91.3% |
| Brazilians | 62.0 /100 | #162 | Good 91.3% |
| Immigrants | Asia | 61.5 /100 | #163 | Good 91.3% |
| Immigrants | China | 60.9 /100 | #164 | Good 91.3% |
| Alsatians | 58.3 /100 | #165 | Average 91.3% |
| Hmong | 58.0 /100 | #166 | Average 91.3% |
| Immigrants | Malaysia | 57.8 /100 | #167 | Average 91.3% |
| Cree | 57.0 /100 | #168 | Average 91.2% |
| Immigrants | Indonesia | 54.9 /100 | #169 | Average 91.2% |
| Delaware | 52.8 /100 | #170 | Average 91.2% |
| Immigrants | Morocco | 51.4 /100 | #171 | Average 91.2% |
| Bermudans | 50.8 /100 | #172 | Average 91.2% |
| Bolivians | 50.4 /100 | #173 | Average 91.2% |
| Immigrants | Nepal | 50.0 /100 | #174 | Average 91.2% |
| Immigrants | Western Asia | 49.0 /100 | #175 | Average 91.2% |
| Iroquois | 48.5 /100 | #176 | Average 91.1% |
| Sierra Leoneans | 47.7 /100 | #177 | Average 91.1% |
| Spanish | 43.7 /100 | #178 | Average 91.1% |