Osage vs Bermudan 12th Grade, No Diploma
COMPARE
Osage
Bermudan
12th Grade, No Diploma
12th Grade, No Diploma Comparison
Osage
Bermudans
91.0%
12TH GRADE, NO DIPLOMA
38.3/ 100
METRIC RATING
183rd/ 347
METRIC RANK
91.2%
12TH GRADE, NO DIPLOMA
50.8/ 100
METRIC RATING
172nd/ 347
METRIC RANK
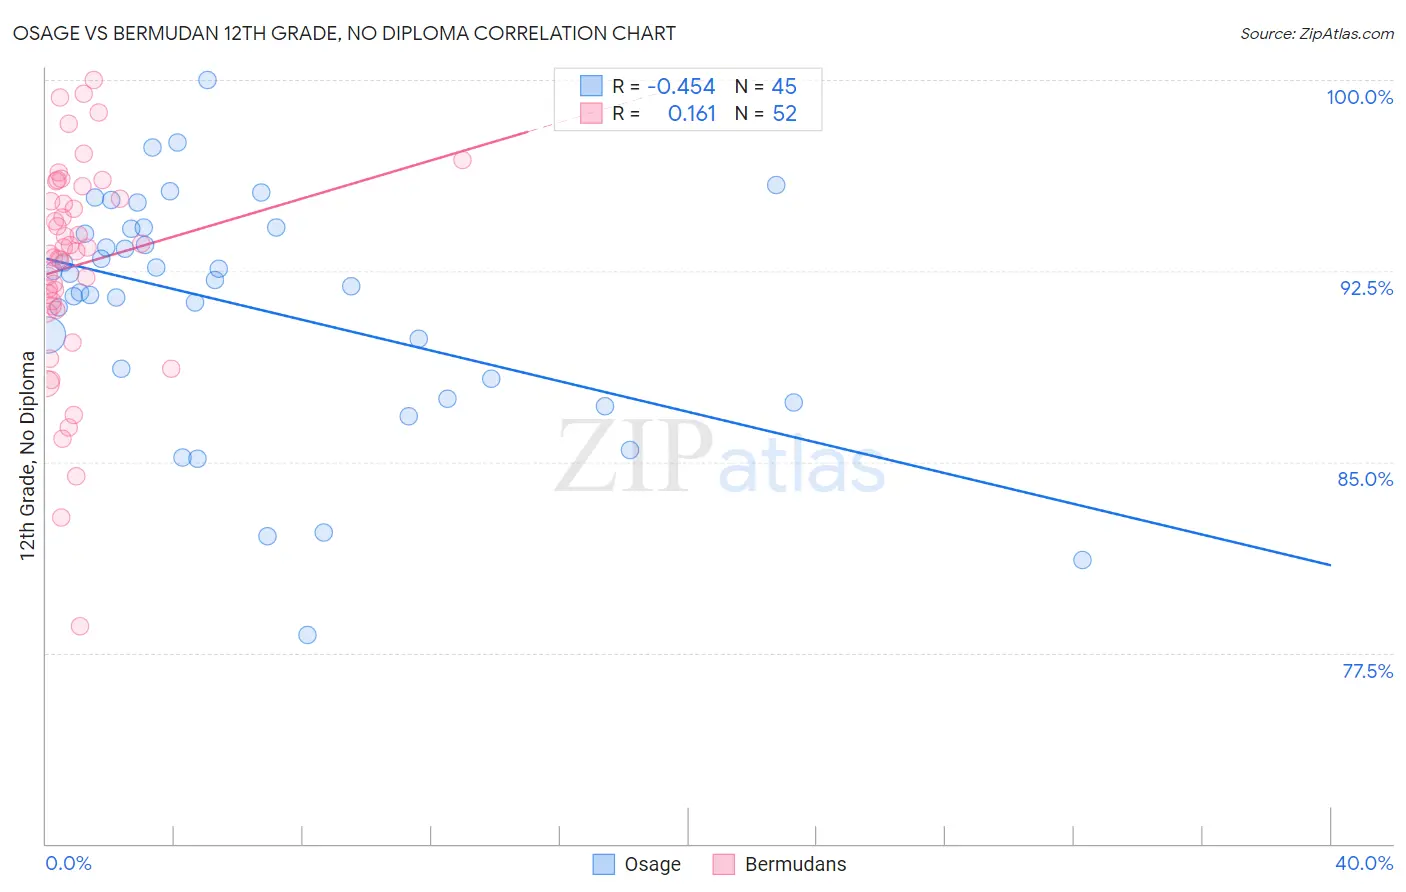
Osage vs Bermudan 12th Grade, No Diploma Correlation Chart
The statistical analysis conducted on geographies consisting of 91,808,929 people shows a moderate negative correlation between the proportion of Osage and percentage of population with at least 12th grade (no diploma) education in the United States with a correlation coefficient (R) of -0.454 and weighted average of 91.0%. Similarly, the statistical analysis conducted on geographies consisting of 55,730,379 people shows a poor positive correlation between the proportion of Bermudans and percentage of population with at least 12th grade (no diploma) education in the United States with a correlation coefficient (R) of 0.161 and weighted average of 91.2%, a difference of 0.16%.
12th Grade, No Diploma Correlation Summary
| Measurement | Osage | Bermudan |
| Minimum | 78.2% | 78.6% |
| Maximum | 100.0% | 100.0% |
| Range | 21.8% | 21.4% |
| Mean | 91.1% | 92.7% |
| Median | 92.1% | 93.4% |
| Interquartile 25% (IQ1) | 87.9% | 91.0% |
| Interquartile 75% (IQ3) | 94.2% | 95.6% |
| Interquartile Range (IQR) | 6.3% | 4.5% |
| Standard Deviation (Sample) | 4.7% | 4.3% |
| Standard Deviation (Population) | 4.6% | 4.2% |
Demographics Similar to Osage and Bermudans by 12th Grade, No Diploma
In terms of 12th grade, no diploma, the demographic groups most similar to Osage are Nonimmigrants (91.0%, a difference of 0.010%), Immigrants from Syria (91.1%, a difference of 0.020%), Guamanian/Chamorro (91.0%, a difference of 0.020%), Spaniard (91.0%, a difference of 0.030%), and Sudanese (91.0%, a difference of 0.050%). Similarly, the demographic groups most similar to Bermudans are Immigrants from Morocco (91.2%, a difference of 0.010%), Bolivian (91.2%, a difference of 0.010%), Immigrants from Nepal (91.2%, a difference of 0.010%), Delaware (91.2%, a difference of 0.020%), and Immigrants from Western Asia (91.2%, a difference of 0.020%).
| Demographics | Rating | Rank | 12th Grade, No Diploma |
| Immigrants | Malaysia | 57.8 /100 | #167 | Average 91.3% |
| Cree | 57.0 /100 | #168 | Average 91.2% |
| Immigrants | Indonesia | 54.9 /100 | #169 | Average 91.2% |
| Delaware | 52.8 /100 | #170 | Average 91.2% |
| Immigrants | Morocco | 51.4 /100 | #171 | Average 91.2% |
| Bermudans | 50.8 /100 | #172 | Average 91.2% |
| Bolivians | 50.4 /100 | #173 | Average 91.2% |
| Immigrants | Nepal | 50.0 /100 | #174 | Average 91.2% |
| Immigrants | Western Asia | 49.0 /100 | #175 | Average 91.2% |
| Iroquois | 48.5 /100 | #176 | Average 91.1% |
| Sierra Leoneans | 47.7 /100 | #177 | Average 91.1% |
| Spanish | 43.7 /100 | #178 | Average 91.1% |
| Immigrants | Chile | 43.3 /100 | #179 | Average 91.1% |
| Immigrants | Syria | 40.3 /100 | #180 | Average 91.1% |
| Guamanians/Chamorros | 39.5 /100 | #181 | Fair 91.0% |
| Immigrants | Nonimmigrants | 38.8 /100 | #182 | Fair 91.0% |
| Osage | 38.3 /100 | #183 | Fair 91.0% |
| Spaniards | 36.2 /100 | #184 | Fair 91.0% |
| Sudanese | 34.4 /100 | #185 | Fair 91.0% |
| Ethiopians | 33.9 /100 | #186 | Fair 91.0% |
| Potawatomi | 32.9 /100 | #187 | Fair 91.0% |