Bhutanese vs Subsaharan African College, Under 1 year
COMPARE
Bhutanese
Subsaharan African
College, Under 1 year
College, Under 1 year Comparison
Bhutanese
Sub-Saharan Africans
70.3%
COLLEGE, UNDER 1 YEAR
99.9/ 100
METRIC RATING
39th/ 347
METRIC RANK
63.2%
COLLEGE, UNDER 1 YEAR
4.4/ 100
METRIC RATING
224th/ 347
METRIC RANK
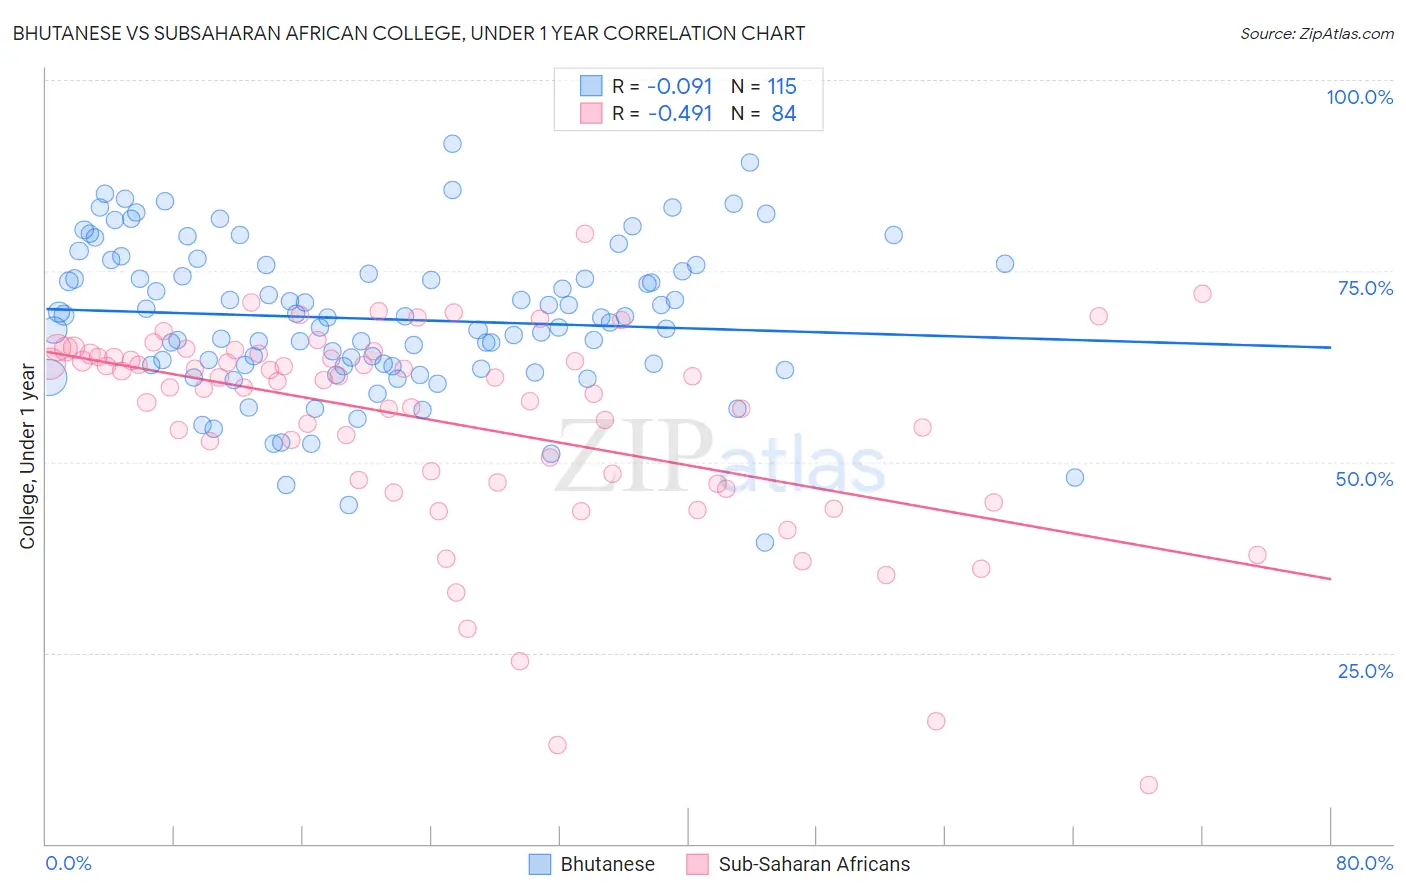
Bhutanese vs Subsaharan African College, Under 1 year Correlation Chart
The statistical analysis conducted on geographies consisting of 455,589,094 people shows a slight negative correlation between the proportion of Bhutanese and percentage of population with at least college, under 1 year education in the United States with a correlation coefficient (R) of -0.091 and weighted average of 70.3%. Similarly, the statistical analysis conducted on geographies consisting of 508,213,731 people shows a moderate negative correlation between the proportion of Sub-Saharan Africans and percentage of population with at least college, under 1 year education in the United States with a correlation coefficient (R) of -0.491 and weighted average of 63.2%, a difference of 11.3%.
College, Under 1 year Correlation Summary
| Measurement | Bhutanese | Subsaharan African |
| Minimum | 39.5% | 7.7% |
| Maximum | 91.6% | 79.8% |
| Range | 52.1% | 72.1% |
| Mean | 68.7% | 55.3% |
| Median | 68.9% | 60.7% |
| Interquartile 25% (IQ1) | 62.6% | 47.4% |
| Interquartile 75% (IQ3) | 75.7% | 63.9% |
| Interquartile Range (IQR) | 13.1% | 16.5% |
| Standard Deviation (Sample) | 9.9% | 13.7% |
| Standard Deviation (Population) | 9.8% | 13.6% |
Similar Demographics by College, Under 1 year
Demographics Similar to Bhutanese by College, Under 1 year
In terms of college, under 1 year, the demographic groups most similar to Bhutanese are Immigrants from Turkey (70.3%, a difference of 0.010%), Australian (70.4%, a difference of 0.020%), Immigrants from Kuwait (70.3%, a difference of 0.050%), Immigrants from Saudi Arabia (70.4%, a difference of 0.090%), and Immigrants from Lithuania (70.3%, a difference of 0.10%).
| Demographics | Rating | Rank | College, Under 1 year |
| Turks | 99.9 /100 | #32 | Exceptional 70.7% |
| Immigrants | South Africa | 99.9 /100 | #33 | Exceptional 70.6% |
| Estonians | 99.9 /100 | #34 | Exceptional 70.6% |
| Russians | 99.9 /100 | #35 | Exceptional 70.5% |
| Immigrants | Sri Lanka | 99.9 /100 | #36 | Exceptional 70.5% |
| Immigrants | Saudi Arabia | 99.9 /100 | #37 | Exceptional 70.4% |
| Australians | 99.9 /100 | #38 | Exceptional 70.4% |
| Bhutanese | 99.9 /100 | #39 | Exceptional 70.3% |
| Immigrants | Turkey | 99.9 /100 | #40 | Exceptional 70.3% |
| Immigrants | Kuwait | 99.9 /100 | #41 | Exceptional 70.3% |
| Immigrants | Lithuania | 99.9 /100 | #42 | Exceptional 70.3% |
| Israelis | 99.9 /100 | #43 | Exceptional 70.2% |
| New Zealanders | 99.9 /100 | #44 | Exceptional 70.2% |
| Immigrants | Norway | 99.9 /100 | #45 | Exceptional 70.2% |
| Immigrants | Latvia | 99.9 /100 | #46 | Exceptional 70.1% |
Demographics Similar to Sub-Saharan Africans by College, Under 1 year
In terms of college, under 1 year, the demographic groups most similar to Sub-Saharan Africans are Immigrants from Costa Rica (63.2%, a difference of 0.030%), Immigrants from Peru (63.1%, a difference of 0.10%), Immigrants from Colombia (63.1%, a difference of 0.12%), Immigrants from Senegal (63.3%, a difference of 0.15%), and Cree (63.3%, a difference of 0.20%).
| Demographics | Rating | Rank | College, Under 1 year |
| Immigrants | Uruguay | 5.8 /100 | #217 | Tragic 63.4% |
| Immigrants | Panama | 5.7 /100 | #218 | Tragic 63.4% |
| Immigrants | Fiji | 5.7 /100 | #219 | Tragic 63.4% |
| Portuguese | 5.6 /100 | #220 | Tragic 63.4% |
| Cree | 5.2 /100 | #221 | Tragic 63.3% |
| Immigrants | Senegal | 5.0 /100 | #222 | Tragic 63.3% |
| Immigrants | Costa Rica | 4.5 /100 | #223 | Tragic 63.2% |
| Sub-Saharan Africans | 4.4 /100 | #224 | Tragic 63.2% |
| Immigrants | Peru | 4.0 /100 | #225 | Tragic 63.1% |
| Immigrants | Colombia | 4.0 /100 | #226 | Tragic 63.1% |
| Immigrants | Ghana | 3.7 /100 | #227 | Tragic 63.1% |
| Samoans | 3.3 /100 | #228 | Tragic 63.0% |
| Liberians | 3.2 /100 | #229 | Tragic 63.0% |
| Immigrants | Nonimmigrants | 3.0 /100 | #230 | Tragic 62.9% |
| Immigrants | Western Africa | 2.4 /100 | #231 | Tragic 62.8% |