Bhutanese vs Trinidadian and Tobagonian College, Under 1 year
COMPARE
Bhutanese
Trinidadian and Tobagonian
College, Under 1 year
College, Under 1 year Comparison
Bhutanese
Trinidadians and Tobagonians
70.3%
COLLEGE, UNDER 1 YEAR
99.9/ 100
METRIC RATING
39th/ 347
METRIC RANK
61.1%
COLLEGE, UNDER 1 YEAR
0.2/ 100
METRIC RATING
264th/ 347
METRIC RANK
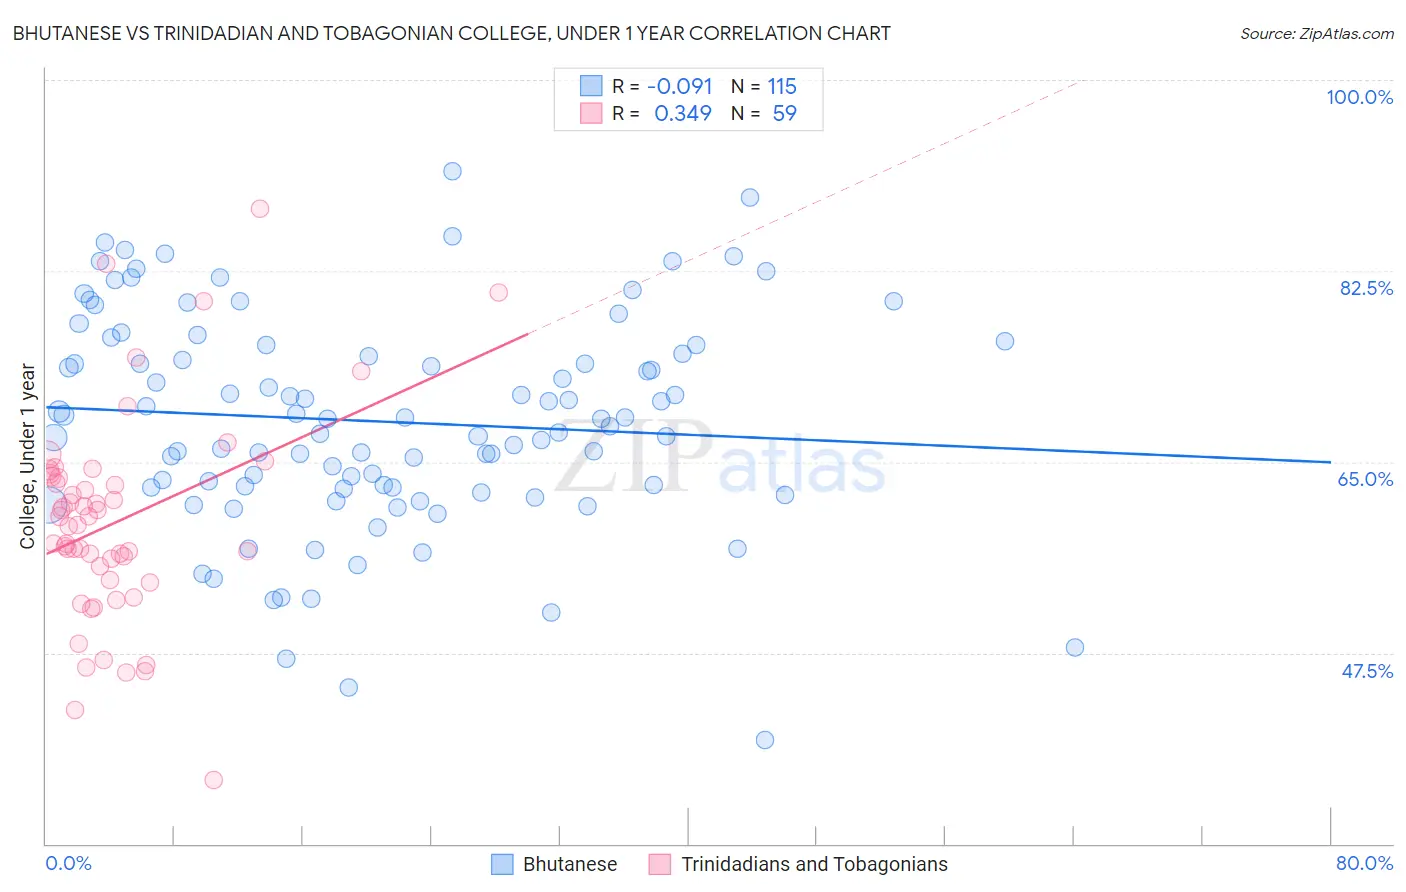
Bhutanese vs Trinidadian and Tobagonian College, Under 1 year Correlation Chart
The statistical analysis conducted on geographies consisting of 455,589,094 people shows a slight negative correlation between the proportion of Bhutanese and percentage of population with at least college, under 1 year education in the United States with a correlation coefficient (R) of -0.091 and weighted average of 70.3%. Similarly, the statistical analysis conducted on geographies consisting of 219,882,137 people shows a mild positive correlation between the proportion of Trinidadians and Tobagonians and percentage of population with at least college, under 1 year education in the United States with a correlation coefficient (R) of 0.349 and weighted average of 61.1%, a difference of 15.2%.
College, Under 1 year Correlation Summary
| Measurement | Bhutanese | Trinidadian and Tobagonian |
| Minimum | 39.5% | 35.8% |
| Maximum | 91.6% | 88.2% |
| Range | 52.1% | 52.3% |
| Mean | 68.7% | 59.5% |
| Median | 68.9% | 59.2% |
| Interquartile 25% (IQ1) | 62.6% | 54.1% |
| Interquartile 75% (IQ3) | 75.7% | 63.6% |
| Interquartile Range (IQR) | 13.1% | 9.5% |
| Standard Deviation (Sample) | 9.9% | 9.6% |
| Standard Deviation (Population) | 9.8% | 9.5% |
Similar Demographics by College, Under 1 year
Demographics Similar to Bhutanese by College, Under 1 year
In terms of college, under 1 year, the demographic groups most similar to Bhutanese are Immigrants from Turkey (70.3%, a difference of 0.010%), Australian (70.4%, a difference of 0.020%), Immigrants from Kuwait (70.3%, a difference of 0.050%), Immigrants from Saudi Arabia (70.4%, a difference of 0.090%), and Immigrants from Lithuania (70.3%, a difference of 0.10%).
| Demographics | Rating | Rank | College, Under 1 year |
| Turks | 99.9 /100 | #32 | Exceptional 70.7% |
| Immigrants | South Africa | 99.9 /100 | #33 | Exceptional 70.6% |
| Estonians | 99.9 /100 | #34 | Exceptional 70.6% |
| Russians | 99.9 /100 | #35 | Exceptional 70.5% |
| Immigrants | Sri Lanka | 99.9 /100 | #36 | Exceptional 70.5% |
| Immigrants | Saudi Arabia | 99.9 /100 | #37 | Exceptional 70.4% |
| Australians | 99.9 /100 | #38 | Exceptional 70.4% |
| Bhutanese | 99.9 /100 | #39 | Exceptional 70.3% |
| Immigrants | Turkey | 99.9 /100 | #40 | Exceptional 70.3% |
| Immigrants | Kuwait | 99.9 /100 | #41 | Exceptional 70.3% |
| Immigrants | Lithuania | 99.9 /100 | #42 | Exceptional 70.3% |
| Israelis | 99.9 /100 | #43 | Exceptional 70.2% |
| New Zealanders | 99.9 /100 | #44 | Exceptional 70.2% |
| Immigrants | Norway | 99.9 /100 | #45 | Exceptional 70.2% |
| Immigrants | Latvia | 99.9 /100 | #46 | Exceptional 70.1% |
Demographics Similar to Trinidadians and Tobagonians by College, Under 1 year
In terms of college, under 1 year, the demographic groups most similar to Trinidadians and Tobagonians are Immigrants from Bahamas (61.1%, a difference of 0.0%), Shoshone (61.1%, a difference of 0.060%), Barbadian (61.1%, a difference of 0.070%), African (61.1%, a difference of 0.11%), and Alaskan Athabascan (61.0%, a difference of 0.12%).
| Demographics | Rating | Rank | College, Under 1 year |
| Immigrants | Laos | 0.3 /100 | #257 | Tragic 61.3% |
| Immigrants | Bangladesh | 0.3 /100 | #258 | Tragic 61.3% |
| Indonesians | 0.3 /100 | #259 | Tragic 61.2% |
| Blackfeet | 0.3 /100 | #260 | Tragic 61.1% |
| Africans | 0.3 /100 | #261 | Tragic 61.1% |
| Barbadians | 0.2 /100 | #262 | Tragic 61.1% |
| Shoshone | 0.2 /100 | #263 | Tragic 61.1% |
| Trinidadians and Tobagonians | 0.2 /100 | #264 | Tragic 61.1% |
| Immigrants | Bahamas | 0.2 /100 | #265 | Tragic 61.1% |
| Alaskan Athabascans | 0.2 /100 | #266 | Tragic 61.0% |
| Americans | 0.2 /100 | #267 | Tragic 61.0% |
| Immigrants | Trinidad and Tobago | 0.1 /100 | #268 | Tragic 60.7% |
| Immigrants | West Indies | 0.1 /100 | #269 | Tragic 60.6% |
| Cheyenne | 0.1 /100 | #270 | Tragic 60.6% |
| U.S. Virgin Islanders | 0.1 /100 | #271 | Tragic 60.6% |