Bhutanese vs Immigrants from Congo College, Under 1 year
COMPARE
Bhutanese
Immigrants from Congo
College, Under 1 year
College, Under 1 year Comparison
Bhutanese
Immigrants from Congo
70.3%
COLLEGE, UNDER 1 YEAR
99.9/ 100
METRIC RATING
39th/ 347
METRIC RANK
61.7%
COLLEGE, UNDER 1 YEAR
0.5/ 100
METRIC RATING
250th/ 347
METRIC RANK
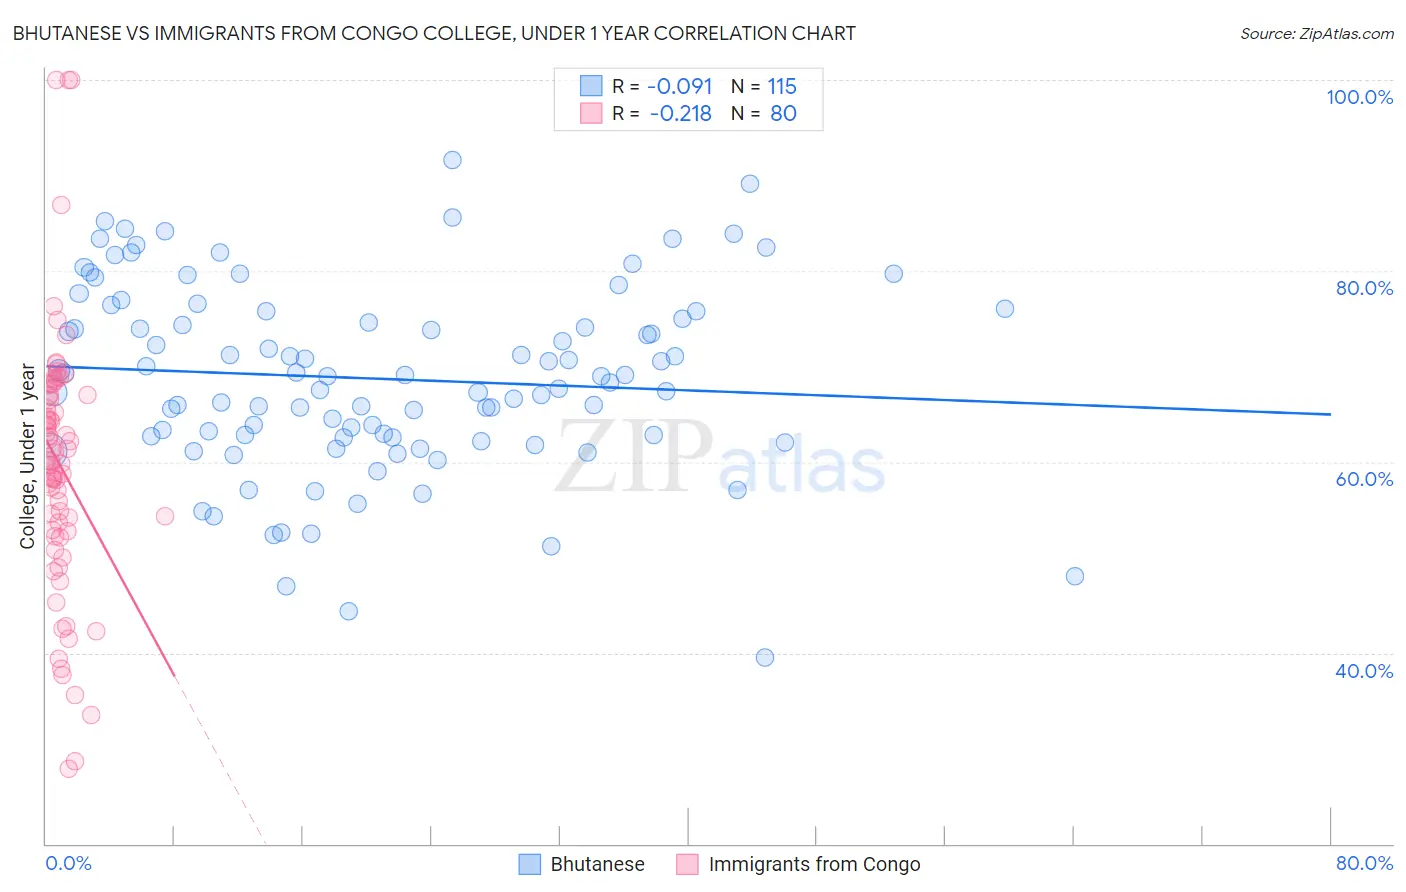
Bhutanese vs Immigrants from Congo College, Under 1 year Correlation Chart
The statistical analysis conducted on geographies consisting of 455,589,094 people shows a slight negative correlation between the proportion of Bhutanese and percentage of population with at least college, under 1 year education in the United States with a correlation coefficient (R) of -0.091 and weighted average of 70.3%. Similarly, the statistical analysis conducted on geographies consisting of 92,134,997 people shows a weak negative correlation between the proportion of Immigrants from Congo and percentage of population with at least college, under 1 year education in the United States with a correlation coefficient (R) of -0.218 and weighted average of 61.7%, a difference of 14.1%.
College, Under 1 year Correlation Summary
| Measurement | Bhutanese | Immigrants from Congo |
| Minimum | 39.5% | 27.9% |
| Maximum | 91.6% | 100.0% |
| Range | 52.1% | 72.1% |
| Mean | 68.7% | 59.7% |
| Median | 68.9% | 60.2% |
| Interquartile 25% (IQ1) | 62.6% | 52.8% |
| Interquartile 75% (IQ3) | 75.7% | 67.0% |
| Interquartile Range (IQR) | 13.1% | 14.2% |
| Standard Deviation (Sample) | 9.9% | 13.7% |
| Standard Deviation (Population) | 9.8% | 13.6% |
Similar Demographics by College, Under 1 year
Demographics Similar to Bhutanese by College, Under 1 year
In terms of college, under 1 year, the demographic groups most similar to Bhutanese are Immigrants from Turkey (70.3%, a difference of 0.010%), Australian (70.4%, a difference of 0.020%), Immigrants from Kuwait (70.3%, a difference of 0.050%), Immigrants from Saudi Arabia (70.4%, a difference of 0.090%), and Immigrants from Lithuania (70.3%, a difference of 0.10%).
| Demographics | Rating | Rank | College, Under 1 year |
| Turks | 99.9 /100 | #32 | Exceptional 70.7% |
| Immigrants | South Africa | 99.9 /100 | #33 | Exceptional 70.6% |
| Estonians | 99.9 /100 | #34 | Exceptional 70.6% |
| Russians | 99.9 /100 | #35 | Exceptional 70.5% |
| Immigrants | Sri Lanka | 99.9 /100 | #36 | Exceptional 70.5% |
| Immigrants | Saudi Arabia | 99.9 /100 | #37 | Exceptional 70.4% |
| Australians | 99.9 /100 | #38 | Exceptional 70.4% |
| Bhutanese | 99.9 /100 | #39 | Exceptional 70.3% |
| Immigrants | Turkey | 99.9 /100 | #40 | Exceptional 70.3% |
| Immigrants | Kuwait | 99.9 /100 | #41 | Exceptional 70.3% |
| Immigrants | Lithuania | 99.9 /100 | #42 | Exceptional 70.3% |
| Israelis | 99.9 /100 | #43 | Exceptional 70.2% |
| New Zealanders | 99.9 /100 | #44 | Exceptional 70.2% |
| Immigrants | Norway | 99.9 /100 | #45 | Exceptional 70.2% |
| Immigrants | Latvia | 99.9 /100 | #46 | Exceptional 70.1% |
Demographics Similar to Immigrants from Congo by College, Under 1 year
In terms of college, under 1 year, the demographic groups most similar to Immigrants from Congo are Vietnamese (61.7%, a difference of 0.0%), Potawatomi (61.8%, a difference of 0.16%), Immigrants from Micronesia (61.5%, a difference of 0.19%), West Indian (61.5%, a difference of 0.30%), and Japanese (61.5%, a difference of 0.30%).
| Demographics | Rating | Rank | College, Under 1 year |
| Hawaiians | 1.1 /100 | #243 | Tragic 62.1% |
| Colville | 1.0 /100 | #244 | Tragic 62.1% |
| Delaware | 0.9 /100 | #245 | Tragic 62.1% |
| Marshallese | 0.8 /100 | #246 | Tragic 61.9% |
| Immigrants | Liberia | 0.8 /100 | #247 | Tragic 61.9% |
| Potawatomi | 0.6 /100 | #248 | Tragic 61.8% |
| Vietnamese | 0.5 /100 | #249 | Tragic 61.7% |
| Immigrants | Congo | 0.5 /100 | #250 | Tragic 61.7% |
| Immigrants | Micronesia | 0.5 /100 | #251 | Tragic 61.5% |
| West Indians | 0.4 /100 | #252 | Tragic 61.5% |
| Japanese | 0.4 /100 | #253 | Tragic 61.5% |
| Immigrants | Cambodia | 0.4 /100 | #254 | Tragic 61.5% |
| Comanche | 0.4 /100 | #255 | Tragic 61.4% |
| Bangladeshis | 0.4 /100 | #256 | Tragic 61.4% |
| Immigrants | Laos | 0.3 /100 | #257 | Tragic 61.3% |