Vietnamese vs Immigrants from South Central Asia GED/Equivalency
COMPARE
Vietnamese
Immigrants from South Central Asia
GED/Equivalency
GED/Equivalency Comparison
Vietnamese
Immigrants from South Central Asia
81.9%
GED/EQUIVALENCY
0.0/ 100
METRIC RATING
296th/ 347
METRIC RANK
88.4%
GED/EQUIVALENCY
99.7/ 100
METRIC RATING
35th/ 347
METRIC RANK
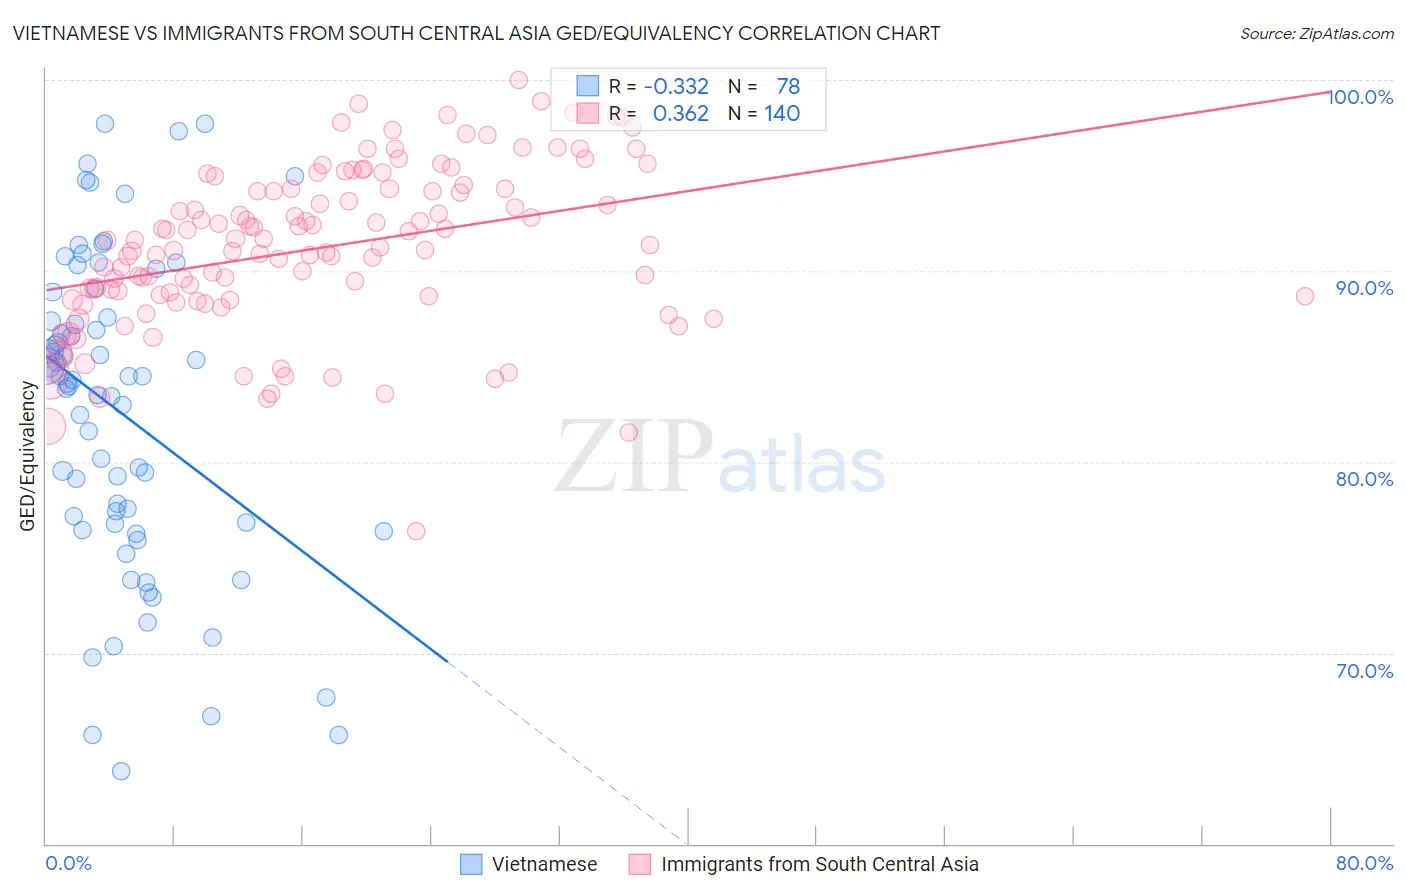
Vietnamese vs Immigrants from South Central Asia GED/Equivalency Correlation Chart
The statistical analysis conducted on geographies consisting of 170,753,564 people shows a mild negative correlation between the proportion of Vietnamese and percentage of population with at least ged/equivalency education in the United States with a correlation coefficient (R) of -0.332 and weighted average of 81.9%. Similarly, the statistical analysis conducted on geographies consisting of 473,113,181 people shows a mild positive correlation between the proportion of Immigrants from South Central Asia and percentage of population with at least ged/equivalency education in the United States with a correlation coefficient (R) of 0.362 and weighted average of 88.4%, a difference of 7.9%.
GED/Equivalency Correlation Summary
| Measurement | Vietnamese | Immigrants from South Central Asia |
| Minimum | 63.8% | 76.4% |
| Maximum | 97.7% | 100.0% |
| Range | 34.0% | 23.6% |
| Mean | 82.6% | 91.2% |
| Median | 84.2% | 91.3% |
| Interquartile 25% (IQ1) | 76.8% | 88.6% |
| Interquartile 75% (IQ3) | 87.6% | 94.3% |
| Interquartile Range (IQR) | 10.8% | 5.7% |
| Standard Deviation (Sample) | 8.2% | 4.3% |
| Standard Deviation (Population) | 8.1% | 4.2% |
Similar Demographics by GED/Equivalency
Demographics Similar to Vietnamese by GED/Equivalency
In terms of ged/equivalency, the demographic groups most similar to Vietnamese are Nepalese (81.9%, a difference of 0.030%), Immigrants from Bangladesh (81.9%, a difference of 0.040%), Immigrants from St. Vincent and the Grenadines (82.0%, a difference of 0.090%), British West Indian (82.0%, a difference of 0.11%), and Paiute (82.0%, a difference of 0.12%).
| Demographics | Rating | Rank | GED/Equivalency |
| Immigrants | Cambodia | 0.0 /100 | #289 | Tragic 82.2% |
| Haitians | 0.0 /100 | #290 | Tragic 82.1% |
| Cubans | 0.0 /100 | #291 | Tragic 82.0% |
| Paiute | 0.0 /100 | #292 | Tragic 82.0% |
| British West Indians | 0.0 /100 | #293 | Tragic 82.0% |
| Immigrants | St. Vincent and the Grenadines | 0.0 /100 | #294 | Tragic 82.0% |
| Nepalese | 0.0 /100 | #295 | Tragic 81.9% |
| Vietnamese | 0.0 /100 | #296 | Tragic 81.9% |
| Immigrants | Bangladesh | 0.0 /100 | #297 | Tragic 81.9% |
| Ute | 0.0 /100 | #298 | Tragic 81.8% |
| Ecuadorians | 0.0 /100 | #299 | Tragic 81.7% |
| Fijians | 0.0 /100 | #300 | Tragic 81.6% |
| Dutch West Indians | 0.0 /100 | #301 | Tragic 81.6% |
| Immigrants | Haiti | 0.0 /100 | #302 | Tragic 81.6% |
| Immigrants | Portugal | 0.0 /100 | #303 | Tragic 81.6% |
Demographics Similar to Immigrants from South Central Asia by GED/Equivalency
In terms of ged/equivalency, the demographic groups most similar to Immigrants from South Central Asia are Immigrants from Sweden (88.4%, a difference of 0.020%), Immigrants from Japan (88.4%, a difference of 0.020%), Immigrants from Belgium (88.3%, a difference of 0.020%), Immigrants from Austria (88.3%, a difference of 0.050%), and Danish (88.4%, a difference of 0.060%).
| Demographics | Rating | Rank | GED/Equivalency |
| Immigrants | Northern Europe | 99.8 /100 | #28 | Exceptional 88.5% |
| Poles | 99.8 /100 | #29 | Exceptional 88.5% |
| Turks | 99.8 /100 | #30 | Exceptional 88.5% |
| Bhutanese | 99.8 /100 | #31 | Exceptional 88.4% |
| Danes | 99.8 /100 | #32 | Exceptional 88.4% |
| Immigrants | Sweden | 99.7 /100 | #33 | Exceptional 88.4% |
| Immigrants | Japan | 99.7 /100 | #34 | Exceptional 88.4% |
| Immigrants | South Central Asia | 99.7 /100 | #35 | Exceptional 88.4% |
| Immigrants | Belgium | 99.7 /100 | #36 | Exceptional 88.3% |
| Immigrants | Austria | 99.7 /100 | #37 | Exceptional 88.3% |
| Burmese | 99.7 /100 | #38 | Exceptional 88.3% |
| Immigrants | Israel | 99.6 /100 | #39 | Exceptional 88.2% |
| Italians | 99.6 /100 | #40 | Exceptional 88.2% |
| Finns | 99.6 /100 | #41 | Exceptional 88.2% |
| Cambodians | 99.6 /100 | #42 | Exceptional 88.2% |