Celtic vs Immigrants from South Central Asia GED/Equivalency
COMPARE
Celtic
Immigrants from South Central Asia
GED/Equivalency
GED/Equivalency Comparison
Celtics
Immigrants from South Central Asia
86.7%
GED/EQUIVALENCY
90.4/ 100
METRIC RATING
125th/ 347
METRIC RANK
88.4%
GED/EQUIVALENCY
99.7/ 100
METRIC RATING
35th/ 347
METRIC RANK
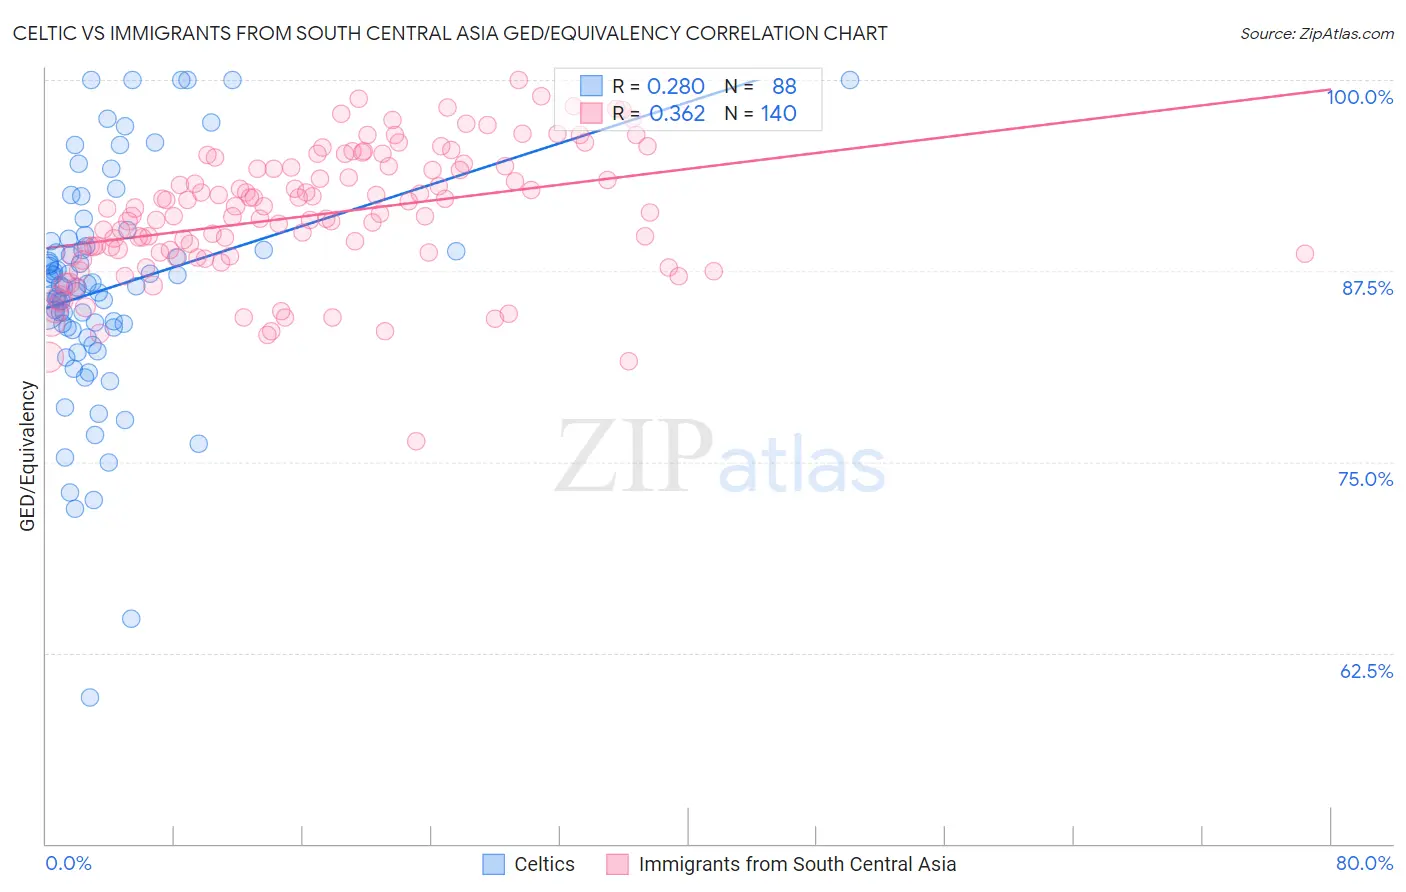
Celtic vs Immigrants from South Central Asia GED/Equivalency Correlation Chart
The statistical analysis conducted on geographies consisting of 168,876,981 people shows a weak positive correlation between the proportion of Celtics and percentage of population with at least ged/equivalency education in the United States with a correlation coefficient (R) of 0.280 and weighted average of 86.7%. Similarly, the statistical analysis conducted on geographies consisting of 473,113,181 people shows a mild positive correlation between the proportion of Immigrants from South Central Asia and percentage of population with at least ged/equivalency education in the United States with a correlation coefficient (R) of 0.362 and weighted average of 88.4%, a difference of 1.9%.
GED/Equivalency Correlation Summary
| Measurement | Celtic | Immigrants from South Central Asia |
| Minimum | 59.6% | 76.4% |
| Maximum | 100.0% | 100.0% |
| Range | 40.4% | 23.6% |
| Mean | 86.4% | 91.2% |
| Median | 86.5% | 91.3% |
| Interquartile 25% (IQ1) | 83.7% | 88.6% |
| Interquartile 75% (IQ3) | 89.3% | 94.3% |
| Interquartile Range (IQR) | 5.6% | 5.7% |
| Standard Deviation (Sample) | 7.4% | 4.3% |
| Standard Deviation (Population) | 7.4% | 4.2% |
Similar Demographics by GED/Equivalency
Demographics Similar to Celtics by GED/Equivalency
In terms of ged/equivalency, the demographic groups most similar to Celtics are Immigrants from Egypt (86.7%, a difference of 0.0%), Immigrants from Italy (86.7%, a difference of 0.010%), Asian (86.7%, a difference of 0.010%), Immigrants from Lebanon (86.8%, a difference of 0.030%), and Immigrants from Jordan (86.8%, a difference of 0.030%).
| Demographics | Rating | Rank | GED/Equivalency |
| French Canadians | 93.2 /100 | #118 | Exceptional 86.9% |
| Immigrants | China | 93.2 /100 | #119 | Exceptional 86.9% |
| Scotch-Irish | 91.6 /100 | #120 | Exceptional 86.8% |
| Immigrants | Lebanon | 90.9 /100 | #121 | Exceptional 86.8% |
| Immigrants | Jordan | 90.8 /100 | #122 | Exceptional 86.8% |
| Immigrants | Italy | 90.5 /100 | #123 | Exceptional 86.7% |
| Immigrants | Egypt | 90.4 /100 | #124 | Exceptional 86.7% |
| Celtics | 90.4 /100 | #125 | Exceptional 86.7% |
| Asians | 90.3 /100 | #126 | Exceptional 86.7% |
| Argentineans | 89.7 /100 | #127 | Excellent 86.7% |
| Yugoslavians | 89.5 /100 | #128 | Excellent 86.7% |
| Immigrants | Ukraine | 88.9 /100 | #129 | Excellent 86.7% |
| Immigrants | Germany | 88.8 /100 | #130 | Excellent 86.7% |
| Immigrants | Spain | 88.5 /100 | #131 | Excellent 86.7% |
| Immigrants | Brazil | 88.4 /100 | #132 | Excellent 86.6% |
Demographics Similar to Immigrants from South Central Asia by GED/Equivalency
In terms of ged/equivalency, the demographic groups most similar to Immigrants from South Central Asia are Immigrants from Sweden (88.4%, a difference of 0.020%), Immigrants from Japan (88.4%, a difference of 0.020%), Immigrants from Belgium (88.3%, a difference of 0.020%), Immigrants from Austria (88.3%, a difference of 0.050%), and Danish (88.4%, a difference of 0.060%).
| Demographics | Rating | Rank | GED/Equivalency |
| Immigrants | Northern Europe | 99.8 /100 | #28 | Exceptional 88.5% |
| Poles | 99.8 /100 | #29 | Exceptional 88.5% |
| Turks | 99.8 /100 | #30 | Exceptional 88.5% |
| Bhutanese | 99.8 /100 | #31 | Exceptional 88.4% |
| Danes | 99.8 /100 | #32 | Exceptional 88.4% |
| Immigrants | Sweden | 99.7 /100 | #33 | Exceptional 88.4% |
| Immigrants | Japan | 99.7 /100 | #34 | Exceptional 88.4% |
| Immigrants | South Central Asia | 99.7 /100 | #35 | Exceptional 88.4% |
| Immigrants | Belgium | 99.7 /100 | #36 | Exceptional 88.3% |
| Immigrants | Austria | 99.7 /100 | #37 | Exceptional 88.3% |
| Burmese | 99.7 /100 | #38 | Exceptional 88.3% |
| Immigrants | Israel | 99.6 /100 | #39 | Exceptional 88.2% |
| Italians | 99.6 /100 | #40 | Exceptional 88.2% |
| Finns | 99.6 /100 | #41 | Exceptional 88.2% |
| Cambodians | 99.6 /100 | #42 | Exceptional 88.2% |