Houma vs Brazilian Bachelor's Degree
COMPARE
Houma
Brazilian
Bachelor's Degree
Bachelor's Degree Comparison
Houma
Brazilians
21.4%
BACHELOR'S DEGREE
0.0/ 100
METRIC RATING
346th/ 347
METRIC RANK
40.8%
BACHELOR'S DEGREE
96.3/ 100
METRIC RATING
113th/ 347
METRIC RANK
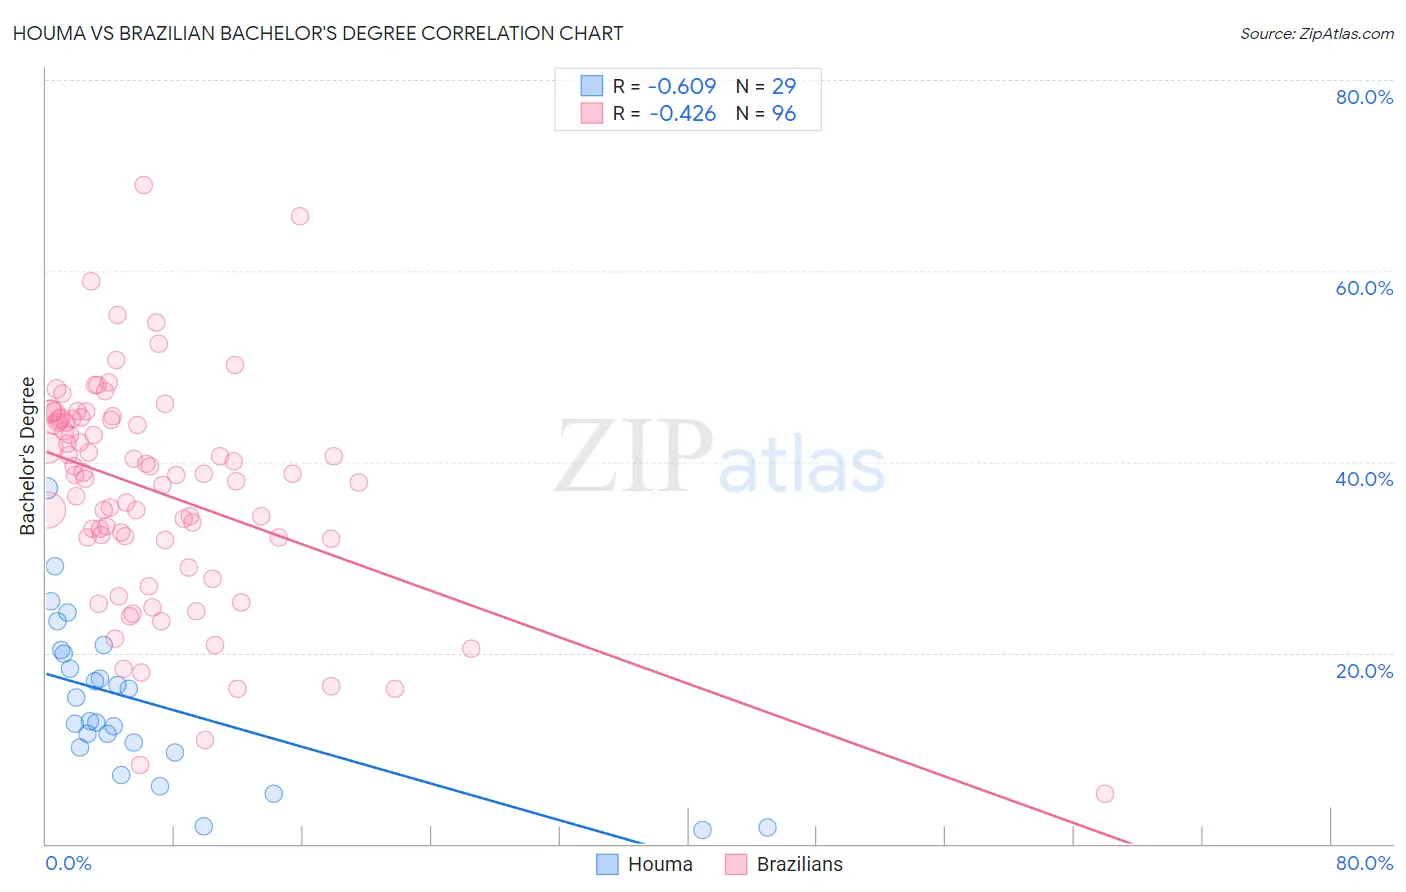
Houma vs Brazilian Bachelor's Degree Correlation Chart
The statistical analysis conducted on geographies consisting of 36,792,534 people shows a significant negative correlation between the proportion of Houma and percentage of population with at least bachelor's degree education in the United States with a correlation coefficient (R) of -0.609 and weighted average of 21.4%. Similarly, the statistical analysis conducted on geographies consisting of 323,923,782 people shows a moderate negative correlation between the proportion of Brazilians and percentage of population with at least bachelor's degree education in the United States with a correlation coefficient (R) of -0.426 and weighted average of 40.8%, a difference of 90.5%.
Bachelor's Degree Correlation Summary
| Measurement | Houma | Brazilian |
| Minimum | 1.5% | 5.3% |
| Maximum | 37.2% | 69.0% |
| Range | 35.8% | 63.7% |
| Mean | 14.8% | 36.9% |
| Median | 12.8% | 38.6% |
| Interquartile 25% (IQ1) | 9.8% | 32.0% |
| Interquartile 75% (IQ3) | 20.1% | 44.5% |
| Interquartile Range (IQR) | 10.3% | 12.5% |
| Standard Deviation (Sample) | 8.4% | 11.5% |
| Standard Deviation (Population) | 8.2% | 11.4% |
Similar Demographics by Bachelor's Degree
Demographics Similar to Houma by Bachelor's Degree
In terms of bachelor's degree, the demographic groups most similar to Houma are Pima (23.2%, a difference of 8.3%), Navajo (23.6%, a difference of 10.2%), Yup'ik (19.4%, a difference of 10.4%), Tohono O'odham (24.4%, a difference of 14.0%), and Yakama (24.5%, a difference of 14.2%).
| Demographics | Rating | Rank | Bachelor's Degree |
| Mexicans | 0.0 /100 | #333 | Tragic 27.1% |
| Arapaho | 0.0 /100 | #334 | Tragic 26.6% |
| Natives/Alaskans | 0.0 /100 | #335 | Tragic 26.3% |
| Immigrants | Mexico | 0.0 /100 | #336 | Tragic 26.1% |
| Inupiat | 0.0 /100 | #337 | Tragic 25.8% |
| Pueblo | 0.0 /100 | #338 | Tragic 25.5% |
| Hopi | 0.0 /100 | #339 | Tragic 25.3% |
| Lumbee | 0.0 /100 | #340 | Tragic 24.8% |
| Yuman | 0.0 /100 | #341 | Tragic 24.5% |
| Yakama | 0.0 /100 | #342 | Tragic 24.5% |
| Tohono O'odham | 0.0 /100 | #343 | Tragic 24.4% |
| Navajo | 0.0 /100 | #344 | Tragic 23.6% |
| Pima | 0.0 /100 | #345 | Tragic 23.2% |
| Houma | 0.0 /100 | #346 | Tragic 21.4% |
| Yup'ik | 0.0 /100 | #347 | Tragic 19.4% |
Demographics Similar to Brazilians by Bachelor's Degree
In terms of bachelor's degree, the demographic groups most similar to Brazilians are Afghan (40.8%, a difference of 0.030%), Ugandan (40.8%, a difference of 0.040%), Immigrants from Chile (40.8%, a difference of 0.090%), Albanian (40.9%, a difference of 0.14%), and Arab (40.9%, a difference of 0.21%).
| Demographics | Rating | Rank | Bachelor's Degree |
| Alsatians | 97.0 /100 | #106 | Exceptional 41.0% |
| Northern Europeans | 96.8 /100 | #107 | Exceptional 41.0% |
| Ukrainians | 96.6 /100 | #108 | Exceptional 40.9% |
| Arabs | 96.6 /100 | #109 | Exceptional 40.9% |
| Albanians | 96.5 /100 | #110 | Exceptional 40.9% |
| Immigrants | Chile | 96.4 /100 | #111 | Exceptional 40.8% |
| Ugandans | 96.3 /100 | #112 | Exceptional 40.8% |
| Brazilians | 96.3 /100 | #113 | Exceptional 40.8% |
| Afghans | 96.2 /100 | #114 | Exceptional 40.8% |
| Palestinians | 95.8 /100 | #115 | Exceptional 40.7% |
| Immigrants | Uganda | 95.7 /100 | #116 | Exceptional 40.7% |
| Austrians | 95.5 /100 | #117 | Exceptional 40.6% |
| Croatians | 95.5 /100 | #118 | Exceptional 40.6% |
| Immigrants | Syria | 94.9 /100 | #119 | Exceptional 40.5% |
| Venezuelans | 94.7 /100 | #120 | Exceptional 40.5% |