Immigrants from Fiji vs Brazilian Bachelor's Degree
COMPARE
Immigrants from Fiji
Brazilian
Bachelor's Degree
Bachelor's Degree Comparison
Immigrants from Fiji
Brazilians
33.7%
BACHELOR'S DEGREE
1.2/ 100
METRIC RATING
245th/ 347
METRIC RANK
40.8%
BACHELOR'S DEGREE
96.3/ 100
METRIC RATING
113th/ 347
METRIC RANK
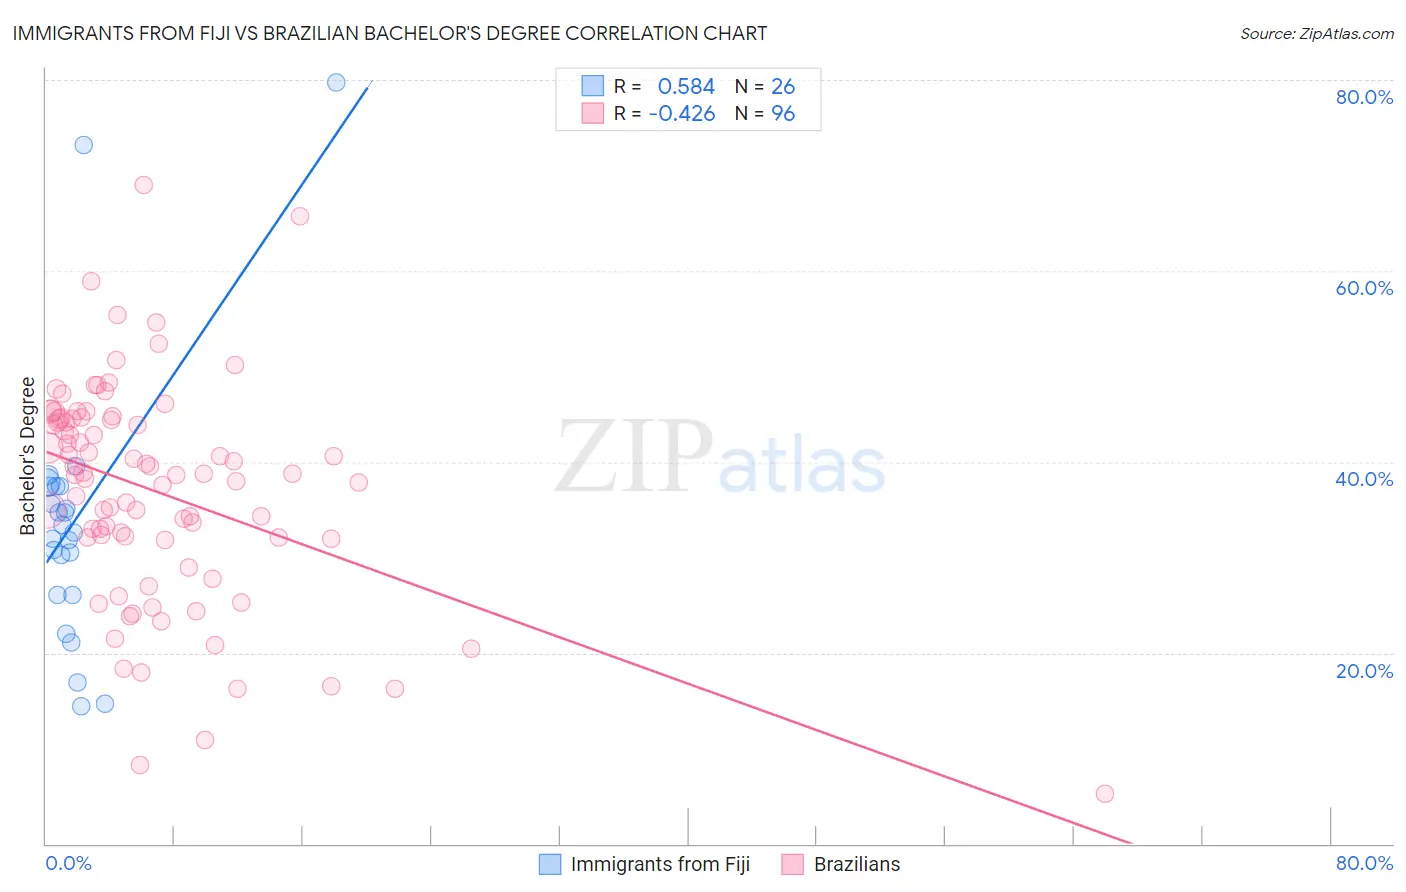
Immigrants from Fiji vs Brazilian Bachelor's Degree Correlation Chart
The statistical analysis conducted on geographies consisting of 93,755,724 people shows a substantial positive correlation between the proportion of Immigrants from Fiji and percentage of population with at least bachelor's degree education in the United States with a correlation coefficient (R) of 0.584 and weighted average of 33.7%. Similarly, the statistical analysis conducted on geographies consisting of 323,923,782 people shows a moderate negative correlation between the proportion of Brazilians and percentage of population with at least bachelor's degree education in the United States with a correlation coefficient (R) of -0.426 and weighted average of 40.8%, a difference of 21.0%.
Bachelor's Degree Correlation Summary
| Measurement | Immigrants from Fiji | Brazilian |
| Minimum | 14.4% | 5.3% |
| Maximum | 79.8% | 69.0% |
| Range | 65.4% | 63.7% |
| Mean | 34.0% | 36.9% |
| Median | 33.0% | 38.6% |
| Interquartile 25% (IQ1) | 26.1% | 32.0% |
| Interquartile 75% (IQ3) | 37.5% | 44.5% |
| Interquartile Range (IQR) | 11.4% | 12.5% |
| Standard Deviation (Sample) | 14.5% | 11.5% |
| Standard Deviation (Population) | 14.3% | 11.4% |
Similar Demographics by Bachelor's Degree
Demographics Similar to Immigrants from Fiji by Bachelor's Degree
In terms of bachelor's degree, the demographic groups most similar to Immigrants from Fiji are Delaware (33.8%, a difference of 0.090%), Jamaican (33.6%, a difference of 0.36%), Immigrants from Congo (33.6%, a difference of 0.45%), Cree (33.6%, a difference of 0.47%), and Immigrants from Guyana (33.9%, a difference of 0.59%).
| Demographics | Rating | Rank | Bachelor's Degree |
| Guyanese | 2.5 /100 | #238 | Tragic 34.5% |
| British West Indians | 2.5 /100 | #239 | Tragic 34.5% |
| Tongans | 2.0 /100 | #240 | Tragic 34.3% |
| Immigrants | Cambodia | 1.9 /100 | #241 | Tragic 34.2% |
| Immigrants | Nonimmigrants | 1.8 /100 | #242 | Tragic 34.2% |
| Immigrants | Guyana | 1.4 /100 | #243 | Tragic 33.9% |
| Delaware | 1.2 /100 | #244 | Tragic 33.8% |
| Immigrants | Fiji | 1.2 /100 | #245 | Tragic 33.7% |
| Jamaicans | 1.0 /100 | #246 | Tragic 33.6% |
| Immigrants | Congo | 1.0 /100 | #247 | Tragic 33.6% |
| Cree | 1.0 /100 | #248 | Tragic 33.6% |
| Immigrants | Liberia | 0.9 /100 | #249 | Tragic 33.5% |
| Indonesians | 0.9 /100 | #250 | Tragic 33.5% |
| Japanese | 0.7 /100 | #251 | Tragic 33.3% |
| Immigrants | Bahamas | 0.7 /100 | #252 | Tragic 33.3% |
Demographics Similar to Brazilians by Bachelor's Degree
In terms of bachelor's degree, the demographic groups most similar to Brazilians are Afghan (40.8%, a difference of 0.030%), Ugandan (40.8%, a difference of 0.040%), Immigrants from Chile (40.8%, a difference of 0.090%), Albanian (40.9%, a difference of 0.14%), and Arab (40.9%, a difference of 0.21%).
| Demographics | Rating | Rank | Bachelor's Degree |
| Alsatians | 97.0 /100 | #106 | Exceptional 41.0% |
| Northern Europeans | 96.8 /100 | #107 | Exceptional 41.0% |
| Ukrainians | 96.6 /100 | #108 | Exceptional 40.9% |
| Arabs | 96.6 /100 | #109 | Exceptional 40.9% |
| Albanians | 96.5 /100 | #110 | Exceptional 40.9% |
| Immigrants | Chile | 96.4 /100 | #111 | Exceptional 40.8% |
| Ugandans | 96.3 /100 | #112 | Exceptional 40.8% |
| Brazilians | 96.3 /100 | #113 | Exceptional 40.8% |
| Afghans | 96.2 /100 | #114 | Exceptional 40.8% |
| Palestinians | 95.8 /100 | #115 | Exceptional 40.7% |
| Immigrants | Uganda | 95.7 /100 | #116 | Exceptional 40.7% |
| Austrians | 95.5 /100 | #117 | Exceptional 40.6% |
| Croatians | 95.5 /100 | #118 | Exceptional 40.6% |
| Immigrants | Syria | 94.9 /100 | #119 | Exceptional 40.5% |
| Venezuelans | 94.7 /100 | #120 | Exceptional 40.5% |