Bahamian vs West Indian College, Under 1 year
COMPARE
Bahamian
West Indian
College, Under 1 year
College, Under 1 year Comparison
Bahamians
West Indians
60.3%
COLLEGE, UNDER 1 YEAR
0.1/ 100
METRIC RATING
277th/ 347
METRIC RANK
61.5%
COLLEGE, UNDER 1 YEAR
0.4/ 100
METRIC RATING
252nd/ 347
METRIC RANK
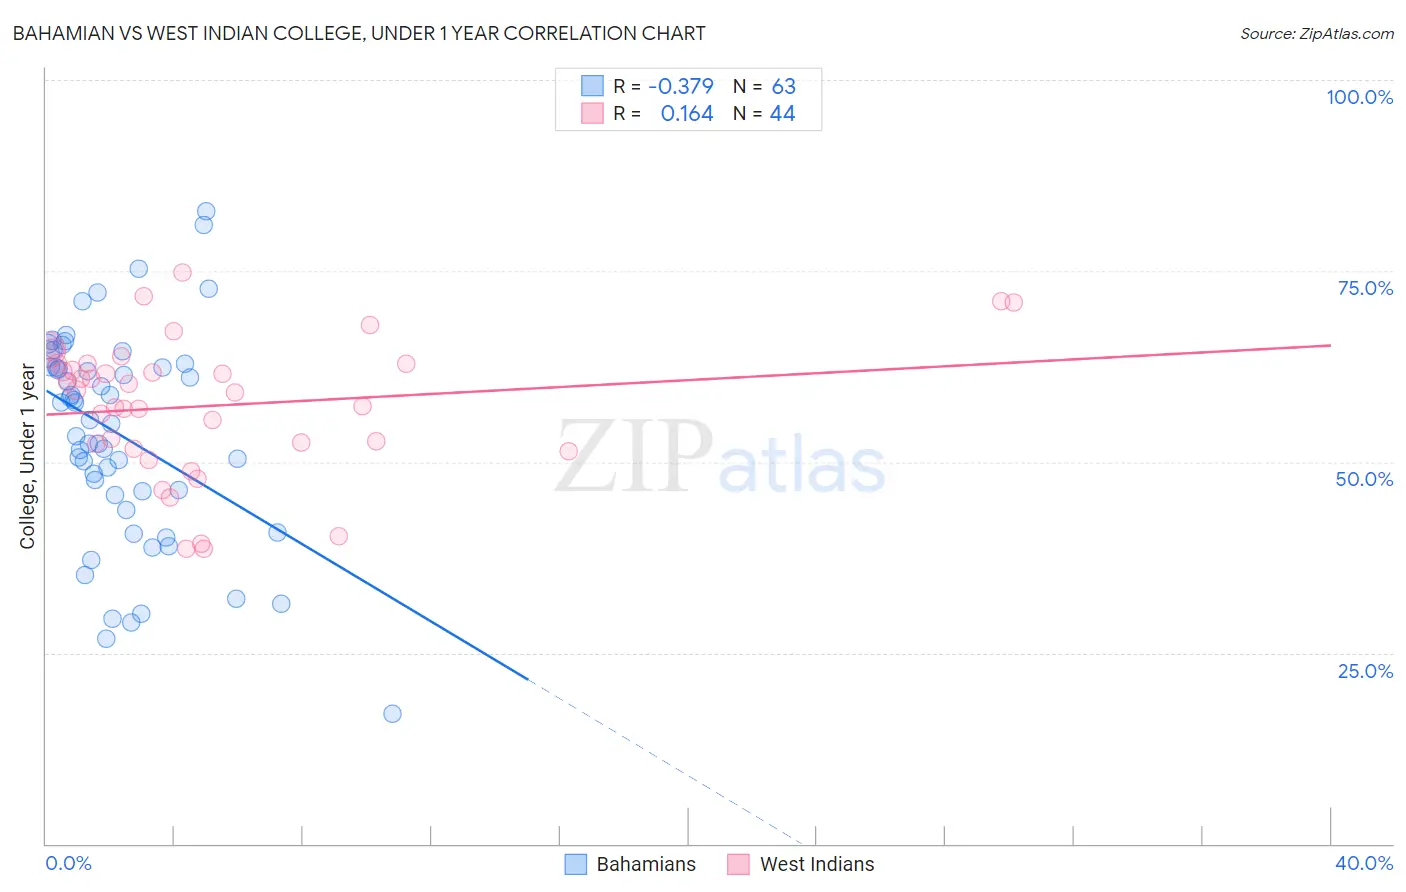
Bahamian vs West Indian College, Under 1 year Correlation Chart
The statistical analysis conducted on geographies consisting of 112,705,508 people shows a mild negative correlation between the proportion of Bahamians and percentage of population with at least college, under 1 year education in the United States with a correlation coefficient (R) of -0.379 and weighted average of 60.3%. Similarly, the statistical analysis conducted on geographies consisting of 254,063,654 people shows a poor positive correlation between the proportion of West Indians and percentage of population with at least college, under 1 year education in the United States with a correlation coefficient (R) of 0.164 and weighted average of 61.5%, a difference of 2.0%.
College, Under 1 year Correlation Summary
| Measurement | Bahamian | West Indian |
| Minimum | 17.1% | 38.5% |
| Maximum | 82.8% | 74.8% |
| Range | 65.7% | 36.3% |
| Mean | 53.5% | 57.4% |
| Median | 55.5% | 59.2% |
| Interquartile 25% (IQ1) | 45.7% | 52.0% |
| Interquartile 75% (IQ3) | 62.4% | 62.9% |
| Interquartile Range (IQR) | 16.7% | 10.8% |
| Standard Deviation (Sample) | 13.8% | 8.9% |
| Standard Deviation (Population) | 13.7% | 8.8% |
Similar Demographics by College, Under 1 year
Demographics Similar to Bahamians by College, Under 1 year
In terms of college, under 1 year, the demographic groups most similar to Bahamians are Yaqui (60.2%, a difference of 0.030%), Ute (60.2%, a difference of 0.050%), Arapaho (60.3%, a difference of 0.14%), Crow (60.2%, a difference of 0.14%), and Immigrants from Barbados (60.4%, a difference of 0.17%).
| Demographics | Rating | Rank | College, Under 1 year |
| Cheyenne | 0.1 /100 | #270 | Tragic 60.6% |
| U.S. Virgin Islanders | 0.1 /100 | #271 | Tragic 60.6% |
| Jamaicans | 0.1 /100 | #272 | Tragic 60.5% |
| Chickasaw | 0.1 /100 | #273 | Tragic 60.4% |
| Alaska Natives | 0.1 /100 | #274 | Tragic 60.4% |
| Immigrants | Barbados | 0.1 /100 | #275 | Tragic 60.4% |
| Arapaho | 0.1 /100 | #276 | Tragic 60.3% |
| Bahamians | 0.1 /100 | #277 | Tragic 60.3% |
| Yaqui | 0.1 /100 | #278 | Tragic 60.2% |
| Ute | 0.1 /100 | #279 | Tragic 60.2% |
| Crow | 0.1 /100 | #280 | Tragic 60.2% |
| Cherokee | 0.1 /100 | #281 | Tragic 60.1% |
| Belizeans | 0.1 /100 | #282 | Tragic 60.1% |
| Immigrants | Jamaica | 0.0 /100 | #283 | Tragic 59.7% |
| Immigrants | St. Vincent and the Grenadines | 0.0 /100 | #284 | Tragic 59.6% |
Demographics Similar to West Indians by College, Under 1 year
In terms of college, under 1 year, the demographic groups most similar to West Indians are Japanese (61.5%, a difference of 0.0%), Immigrants from Cambodia (61.5%, a difference of 0.0%), Immigrants from Micronesia (61.5%, a difference of 0.11%), Comanche (61.4%, a difference of 0.13%), and Bangladeshi (61.4%, a difference of 0.17%).
| Demographics | Rating | Rank | College, Under 1 year |
| Delaware | 0.9 /100 | #245 | Tragic 62.1% |
| Marshallese | 0.8 /100 | #246 | Tragic 61.9% |
| Immigrants | Liberia | 0.8 /100 | #247 | Tragic 61.9% |
| Potawatomi | 0.6 /100 | #248 | Tragic 61.8% |
| Vietnamese | 0.5 /100 | #249 | Tragic 61.7% |
| Immigrants | Congo | 0.5 /100 | #250 | Tragic 61.7% |
| Immigrants | Micronesia | 0.5 /100 | #251 | Tragic 61.5% |
| West Indians | 0.4 /100 | #252 | Tragic 61.5% |
| Japanese | 0.4 /100 | #253 | Tragic 61.5% |
| Immigrants | Cambodia | 0.4 /100 | #254 | Tragic 61.5% |
| Comanche | 0.4 /100 | #255 | Tragic 61.4% |
| Bangladeshis | 0.4 /100 | #256 | Tragic 61.4% |
| Immigrants | Laos | 0.3 /100 | #257 | Tragic 61.3% |
| Immigrants | Bangladesh | 0.3 /100 | #258 | Tragic 61.3% |
| Indonesians | 0.3 /100 | #259 | Tragic 61.2% |