Indian (Asian) vs West Indian College, Under 1 year
COMPARE
Indian (Asian)
West Indian
College, Under 1 year
College, Under 1 year Comparison
Indians (Asian)
West Indians
70.8%
COLLEGE, UNDER 1 YEAR
99.9/ 100
METRIC RATING
31st/ 347
METRIC RANK
61.5%
COLLEGE, UNDER 1 YEAR
0.4/ 100
METRIC RATING
252nd/ 347
METRIC RANK
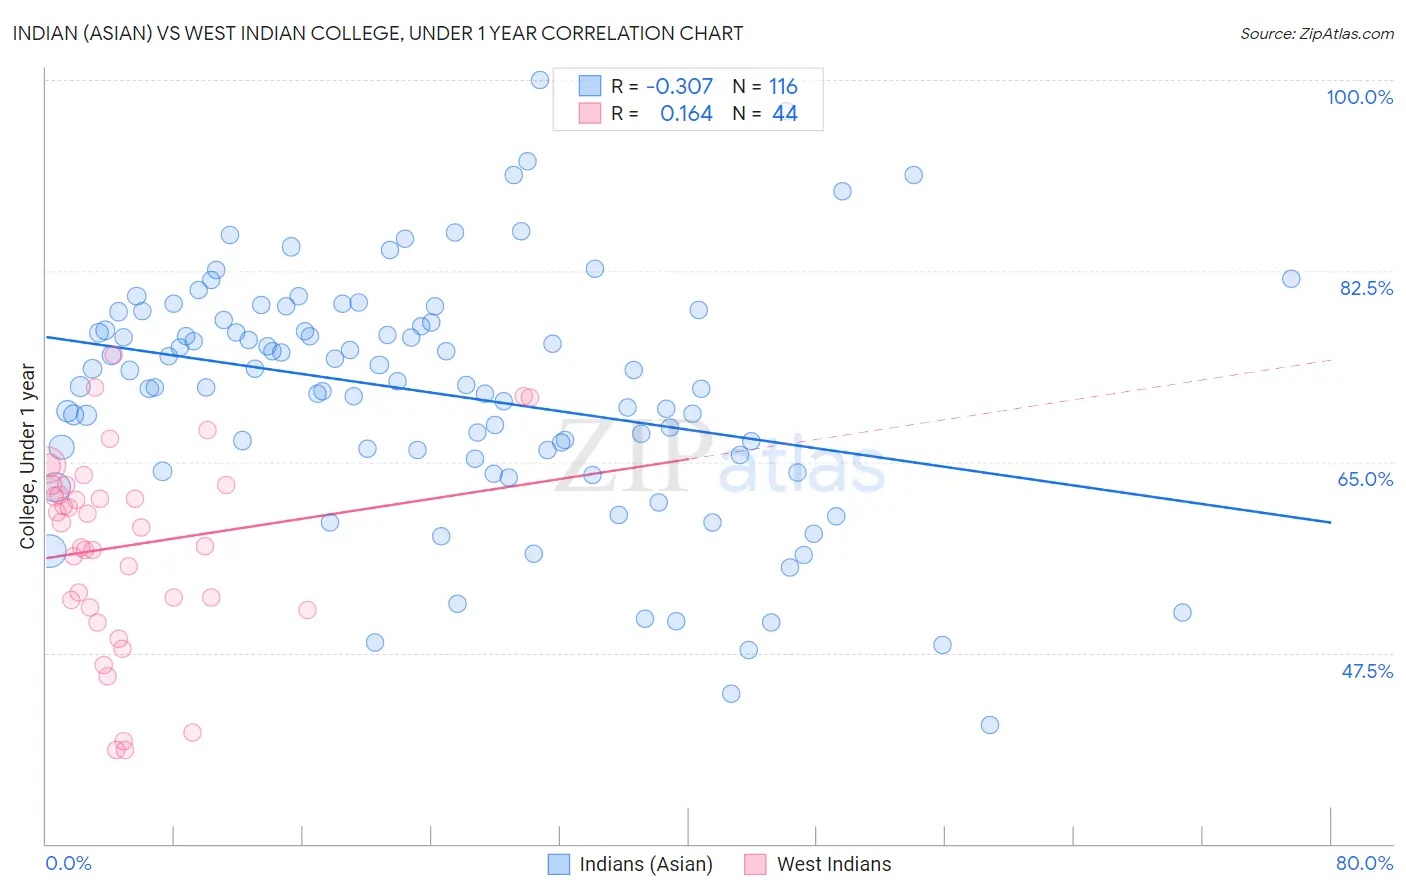
Indian (Asian) vs West Indian College, Under 1 year Correlation Chart
The statistical analysis conducted on geographies consisting of 495,343,184 people shows a mild negative correlation between the proportion of Indians (Asian) and percentage of population with at least college, under 1 year education in the United States with a correlation coefficient (R) of -0.307 and weighted average of 70.8%. Similarly, the statistical analysis conducted on geographies consisting of 254,063,654 people shows a poor positive correlation between the proportion of West Indians and percentage of population with at least college, under 1 year education in the United States with a correlation coefficient (R) of 0.164 and weighted average of 61.5%, a difference of 15.1%.
College, Under 1 year Correlation Summary
| Measurement | Indian (Asian) | West Indian |
| Minimum | 40.9% | 38.5% |
| Maximum | 100.0% | 74.8% |
| Range | 59.1% | 36.3% |
| Mean | 71.3% | 57.4% |
| Median | 72.2% | 59.2% |
| Interquartile 25% (IQ1) | 65.9% | 52.0% |
| Interquartile 75% (IQ3) | 77.9% | 62.9% |
| Interquartile Range (IQR) | 12.0% | 10.8% |
| Standard Deviation (Sample) | 11.1% | 8.9% |
| Standard Deviation (Population) | 11.0% | 8.8% |
Similar Demographics by College, Under 1 year
Demographics Similar to Indians (Asian) by College, Under 1 year
In terms of college, under 1 year, the demographic groups most similar to Indians (Asian) are Turkish (70.7%, a difference of 0.080%), Immigrants from China (70.9%, a difference of 0.11%), Immigrants from South Africa (70.6%, a difference of 0.25%), Estonian (70.6%, a difference of 0.27%), and Immigrants from Hong Kong (71.0%, a difference of 0.29%).
| Demographics | Rating | Rank | College, Under 1 year |
| Soviet Union | 100.0 /100 | #24 | Exceptional 71.1% |
| Bulgarians | 100.0 /100 | #25 | Exceptional 71.1% |
| Immigrants | Denmark | 100.0 /100 | #26 | Exceptional 71.0% |
| Immigrants | Ireland | 100.0 /100 | #27 | Exceptional 71.0% |
| Immigrants | Hong Kong | 100.0 /100 | #28 | Exceptional 71.0% |
| Immigrants | France | 100.0 /100 | #29 | Exceptional 71.0% |
| Immigrants | China | 99.9 /100 | #30 | Exceptional 70.9% |
| Indians (Asian) | 99.9 /100 | #31 | Exceptional 70.8% |
| Turks | 99.9 /100 | #32 | Exceptional 70.7% |
| Immigrants | South Africa | 99.9 /100 | #33 | Exceptional 70.6% |
| Estonians | 99.9 /100 | #34 | Exceptional 70.6% |
| Russians | 99.9 /100 | #35 | Exceptional 70.5% |
| Immigrants | Sri Lanka | 99.9 /100 | #36 | Exceptional 70.5% |
| Immigrants | Saudi Arabia | 99.9 /100 | #37 | Exceptional 70.4% |
| Australians | 99.9 /100 | #38 | Exceptional 70.4% |
Demographics Similar to West Indians by College, Under 1 year
In terms of college, under 1 year, the demographic groups most similar to West Indians are Japanese (61.5%, a difference of 0.0%), Immigrants from Cambodia (61.5%, a difference of 0.0%), Immigrants from Micronesia (61.5%, a difference of 0.11%), Comanche (61.4%, a difference of 0.13%), and Bangladeshi (61.4%, a difference of 0.17%).
| Demographics | Rating | Rank | College, Under 1 year |
| Delaware | 0.9 /100 | #245 | Tragic 62.1% |
| Marshallese | 0.8 /100 | #246 | Tragic 61.9% |
| Immigrants | Liberia | 0.8 /100 | #247 | Tragic 61.9% |
| Potawatomi | 0.6 /100 | #248 | Tragic 61.8% |
| Vietnamese | 0.5 /100 | #249 | Tragic 61.7% |
| Immigrants | Congo | 0.5 /100 | #250 | Tragic 61.7% |
| Immigrants | Micronesia | 0.5 /100 | #251 | Tragic 61.5% |
| West Indians | 0.4 /100 | #252 | Tragic 61.5% |
| Japanese | 0.4 /100 | #253 | Tragic 61.5% |
| Immigrants | Cambodia | 0.4 /100 | #254 | Tragic 61.5% |
| Comanche | 0.4 /100 | #255 | Tragic 61.4% |
| Bangladeshis | 0.4 /100 | #256 | Tragic 61.4% |
| Immigrants | Laos | 0.3 /100 | #257 | Tragic 61.3% |
| Immigrants | Bangladesh | 0.3 /100 | #258 | Tragic 61.3% |
| Indonesians | 0.3 /100 | #259 | Tragic 61.2% |