Honduran vs West Indian College, Under 1 year
COMPARE
Honduran
West Indian
College, Under 1 year
College, Under 1 year Comparison
Hondurans
West Indians
57.1%
COLLEGE, UNDER 1 YEAR
0.0/ 100
METRIC RATING
315th/ 347
METRIC RANK
61.5%
COLLEGE, UNDER 1 YEAR
0.4/ 100
METRIC RATING
252nd/ 347
METRIC RANK
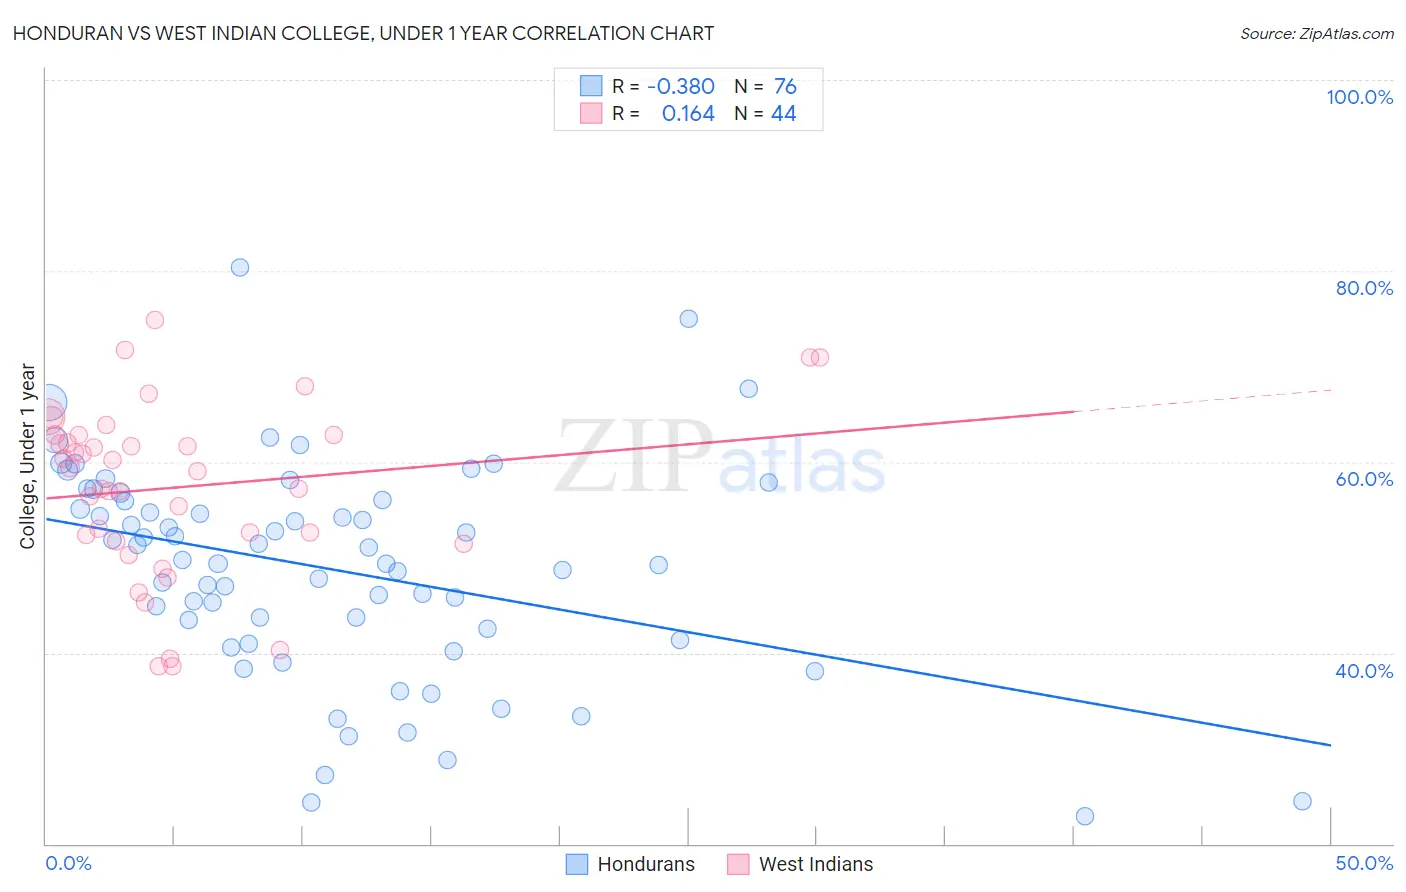
Honduran vs West Indian College, Under 1 year Correlation Chart
The statistical analysis conducted on geographies consisting of 357,856,249 people shows a mild negative correlation between the proportion of Hondurans and percentage of population with at least college, under 1 year education in the United States with a correlation coefficient (R) of -0.380 and weighted average of 57.1%. Similarly, the statistical analysis conducted on geographies consisting of 254,063,654 people shows a poor positive correlation between the proportion of West Indians and percentage of population with at least college, under 1 year education in the United States with a correlation coefficient (R) of 0.164 and weighted average of 61.5%, a difference of 7.7%.
College, Under 1 year Correlation Summary
| Measurement | Honduran | West Indian |
| Minimum | 22.9% | 38.5% |
| Maximum | 80.4% | 74.8% |
| Range | 57.4% | 36.3% |
| Mean | 48.8% | 57.4% |
| Median | 49.5% | 59.2% |
| Interquartile 25% (IQ1) | 41.9% | 52.0% |
| Interquartile 75% (IQ3) | 55.9% | 62.9% |
| Interquartile Range (IQR) | 14.0% | 10.8% |
| Standard Deviation (Sample) | 11.3% | 8.9% |
| Standard Deviation (Population) | 11.2% | 8.8% |
Similar Demographics by College, Under 1 year
Demographics Similar to Hondurans by College, Under 1 year
In terms of college, under 1 year, the demographic groups most similar to Hondurans are Hopi (57.1%, a difference of 0.040%), Menominee (57.0%, a difference of 0.050%), Hispanic or Latino (57.0%, a difference of 0.090%), Dutch West Indian (57.2%, a difference of 0.16%), and Immigrants from Haiti (56.9%, a difference of 0.21%).
| Demographics | Rating | Rank | College, Under 1 year |
| Central Americans | 0.0 /100 | #308 | Tragic 57.7% |
| Immigrants | Nicaragua | 0.0 /100 | #309 | Tragic 57.6% |
| Pueblo | 0.0 /100 | #310 | Tragic 57.4% |
| Cajuns | 0.0 /100 | #311 | Tragic 57.3% |
| Salvadorans | 0.0 /100 | #312 | Tragic 57.3% |
| Dutch West Indians | 0.0 /100 | #313 | Tragic 57.2% |
| Hopi | 0.0 /100 | #314 | Tragic 57.1% |
| Hondurans | 0.0 /100 | #315 | Tragic 57.1% |
| Menominee | 0.0 /100 | #316 | Tragic 57.0% |
| Hispanics or Latinos | 0.0 /100 | #317 | Tragic 57.0% |
| Immigrants | Haiti | 0.0 /100 | #318 | Tragic 56.9% |
| Puerto Ricans | 0.0 /100 | #319 | Tragic 56.8% |
| Guatemalans | 0.0 /100 | #320 | Tragic 56.8% |
| Natives/Alaskans | 0.0 /100 | #321 | Tragic 56.6% |
| Immigrants | Caribbean | 0.0 /100 | #322 | Tragic 56.6% |
Demographics Similar to West Indians by College, Under 1 year
In terms of college, under 1 year, the demographic groups most similar to West Indians are Japanese (61.5%, a difference of 0.0%), Immigrants from Cambodia (61.5%, a difference of 0.0%), Immigrants from Micronesia (61.5%, a difference of 0.11%), Comanche (61.4%, a difference of 0.13%), and Bangladeshi (61.4%, a difference of 0.17%).
| Demographics | Rating | Rank | College, Under 1 year |
| Delaware | 0.9 /100 | #245 | Tragic 62.1% |
| Marshallese | 0.8 /100 | #246 | Tragic 61.9% |
| Immigrants | Liberia | 0.8 /100 | #247 | Tragic 61.9% |
| Potawatomi | 0.6 /100 | #248 | Tragic 61.8% |
| Vietnamese | 0.5 /100 | #249 | Tragic 61.7% |
| Immigrants | Congo | 0.5 /100 | #250 | Tragic 61.7% |
| Immigrants | Micronesia | 0.5 /100 | #251 | Tragic 61.5% |
| West Indians | 0.4 /100 | #252 | Tragic 61.5% |
| Japanese | 0.4 /100 | #253 | Tragic 61.5% |
| Immigrants | Cambodia | 0.4 /100 | #254 | Tragic 61.5% |
| Comanche | 0.4 /100 | #255 | Tragic 61.4% |
| Bangladeshis | 0.4 /100 | #256 | Tragic 61.4% |
| Immigrants | Laos | 0.3 /100 | #257 | Tragic 61.3% |
| Immigrants | Bangladesh | 0.3 /100 | #258 | Tragic 61.3% |
| Indonesians | 0.3 /100 | #259 | Tragic 61.2% |