Bahamian vs West Indian Ambulatory Disability
COMPARE
Bahamian
West Indian
Ambulatory Disability
Ambulatory Disability Comparison
Bahamians
West Indians
6.6%
AMBULATORY DISABILITY
0.2/ 100
METRIC RATING
265th/ 347
METRIC RANK
6.9%
AMBULATORY DISABILITY
0.0/ 100
METRIC RATING
291st/ 347
METRIC RANK
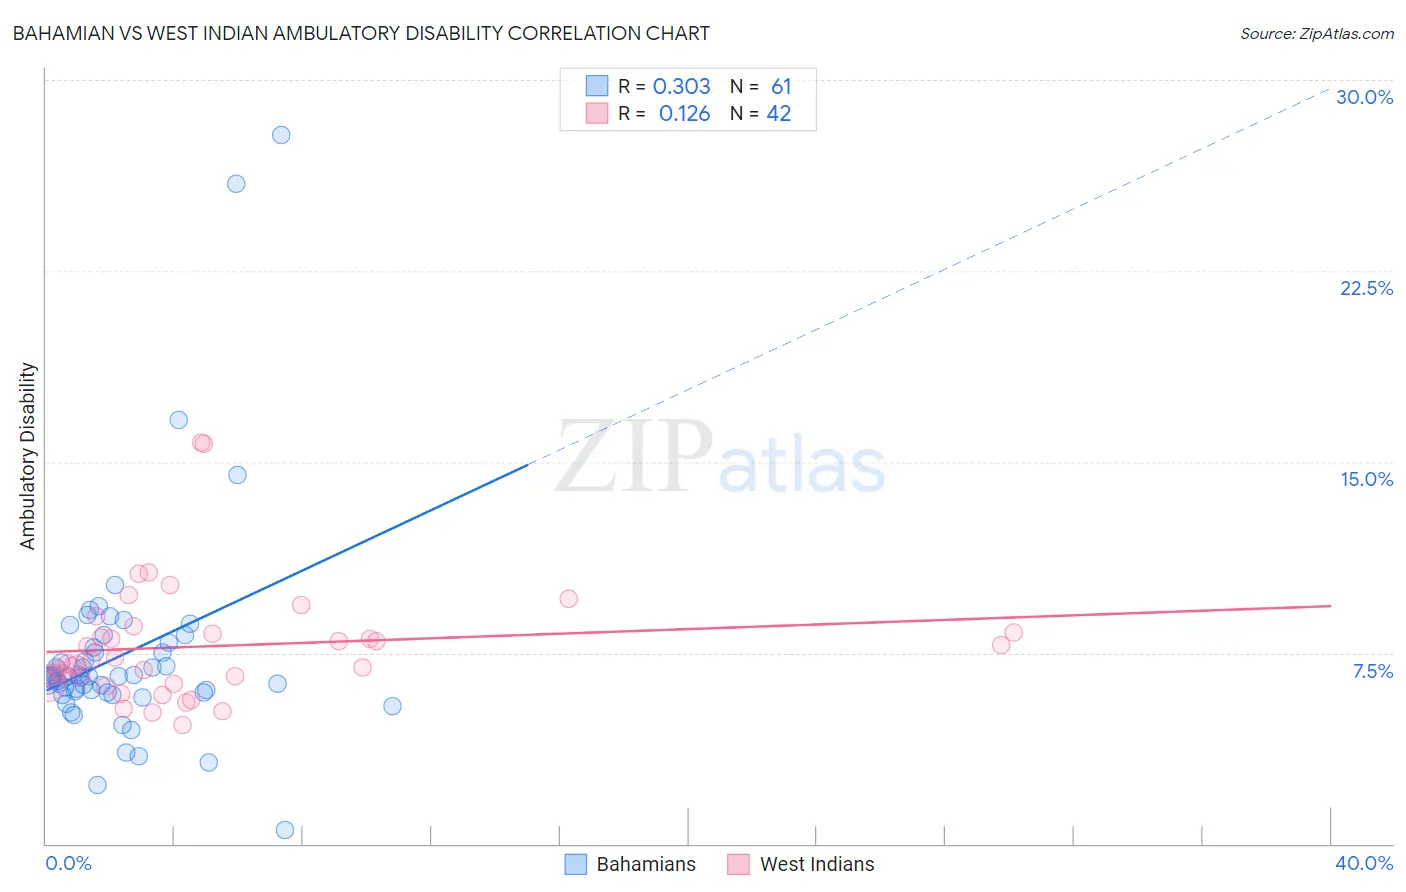
Bahamian vs West Indian Ambulatory Disability Correlation Chart
The statistical analysis conducted on geographies consisting of 112,670,822 people shows a mild positive correlation between the proportion of Bahamians and percentage of population with ambulatory disability in the United States with a correlation coefficient (R) of 0.303 and weighted average of 6.6%. Similarly, the statistical analysis conducted on geographies consisting of 253,984,061 people shows a poor positive correlation between the proportion of West Indians and percentage of population with ambulatory disability in the United States with a correlation coefficient (R) of 0.126 and weighted average of 6.9%, a difference of 3.9%.
Ambulatory Disability Correlation Summary
| Measurement | Bahamian | West Indian |
| Minimum | 0.55% | 4.7% |
| Maximum | 27.8% | 15.7% |
| Range | 27.3% | 11.1% |
| Mean | 7.4% | 7.8% |
| Median | 6.6% | 7.2% |
| Interquartile 25% (IQ1) | 5.9% | 6.3% |
| Interquartile 75% (IQ3) | 7.8% | 8.3% |
| Interquartile Range (IQR) | 1.9% | 2.0% |
| Standard Deviation (Sample) | 4.3% | 2.3% |
| Standard Deviation (Population) | 4.3% | 2.3% |
Similar Demographics by Ambulatory Disability
Demographics Similar to Bahamians by Ambulatory Disability
In terms of ambulatory disability, the demographic groups most similar to Bahamians are Nepalese (6.6%, a difference of 0.060%), Guyanese (6.6%, a difference of 0.12%), Trinidadian and Tobagonian (6.6%, a difference of 0.25%), Spanish (6.6%, a difference of 0.26%), and Hmong (6.6%, a difference of 0.46%).
| Demographics | Rating | Rank | Ambulatory Disability |
| Spanish American Indians | 0.5 /100 | #258 | Tragic 6.5% |
| Aleuts | 0.4 /100 | #259 | Tragic 6.6% |
| Immigrants | Belize | 0.4 /100 | #260 | Tragic 6.6% |
| Irish | 0.4 /100 | #261 | Tragic 6.6% |
| English | 0.4 /100 | #262 | Tragic 6.6% |
| Hmong | 0.3 /100 | #263 | Tragic 6.6% |
| Nepalese | 0.2 /100 | #264 | Tragic 6.6% |
| Bahamians | 0.2 /100 | #265 | Tragic 6.6% |
| Guyanese | 0.2 /100 | #266 | Tragic 6.6% |
| Trinidadians and Tobagonians | 0.2 /100 | #267 | Tragic 6.6% |
| Spanish | 0.2 /100 | #268 | Tragic 6.6% |
| French | 0.1 /100 | #269 | Tragic 6.6% |
| Slovaks | 0.1 /100 | #270 | Tragic 6.7% |
| Immigrants | Trinidad and Tobago | 0.1 /100 | #271 | Tragic 6.7% |
| French Canadians | 0.1 /100 | #272 | Tragic 6.7% |
Demographics Similar to West Indians by Ambulatory Disability
In terms of ambulatory disability, the demographic groups most similar to West Indians are Cheyenne (6.9%, a difference of 0.060%), Scotch-Irish (6.9%, a difference of 0.10%), Immigrants from Dominica (6.9%, a difference of 0.12%), Nonimmigrants (6.9%, a difference of 0.27%), and Immigrants from St. Vincent and the Grenadines (6.9%, a difference of 0.30%).
| Demographics | Rating | Rank | Ambulatory Disability |
| Immigrants | Jamaica | 0.0 /100 | #284 | Tragic 6.8% |
| Fijians | 0.0 /100 | #285 | Tragic 6.8% |
| Yakama | 0.0 /100 | #286 | Tragic 6.8% |
| U.S. Virgin Islanders | 0.0 /100 | #287 | Tragic 6.8% |
| Immigrants | Nonimmigrants | 0.0 /100 | #288 | Tragic 6.9% |
| Immigrants | Dominica | 0.0 /100 | #289 | Tragic 6.9% |
| Scotch-Irish | 0.0 /100 | #290 | Tragic 6.9% |
| West Indians | 0.0 /100 | #291 | Tragic 6.9% |
| Cheyenne | 0.0 /100 | #292 | Tragic 6.9% |
| Immigrants | St. Vincent and the Grenadines | 0.0 /100 | #293 | Tragic 6.9% |
| Cape Verdeans | 0.0 /100 | #294 | Tragic 6.9% |
| Crow | 0.0 /100 | #295 | Tragic 6.9% |
| Alaskan Athabascans | 0.0 /100 | #296 | Tragic 6.9% |
| French American Indians | 0.0 /100 | #297 | Tragic 6.9% |
| Immigrants | Grenada | 0.0 /100 | #298 | Tragic 6.9% |