Argentinean vs West Indian College, Under 1 year
COMPARE
Argentinean
West Indian
College, Under 1 year
College, Under 1 year Comparison
Argentineans
West Indians
68.4%
COLLEGE, UNDER 1 YEAR
98.4/ 100
METRIC RATING
83rd/ 347
METRIC RANK
61.5%
COLLEGE, UNDER 1 YEAR
0.4/ 100
METRIC RATING
252nd/ 347
METRIC RANK
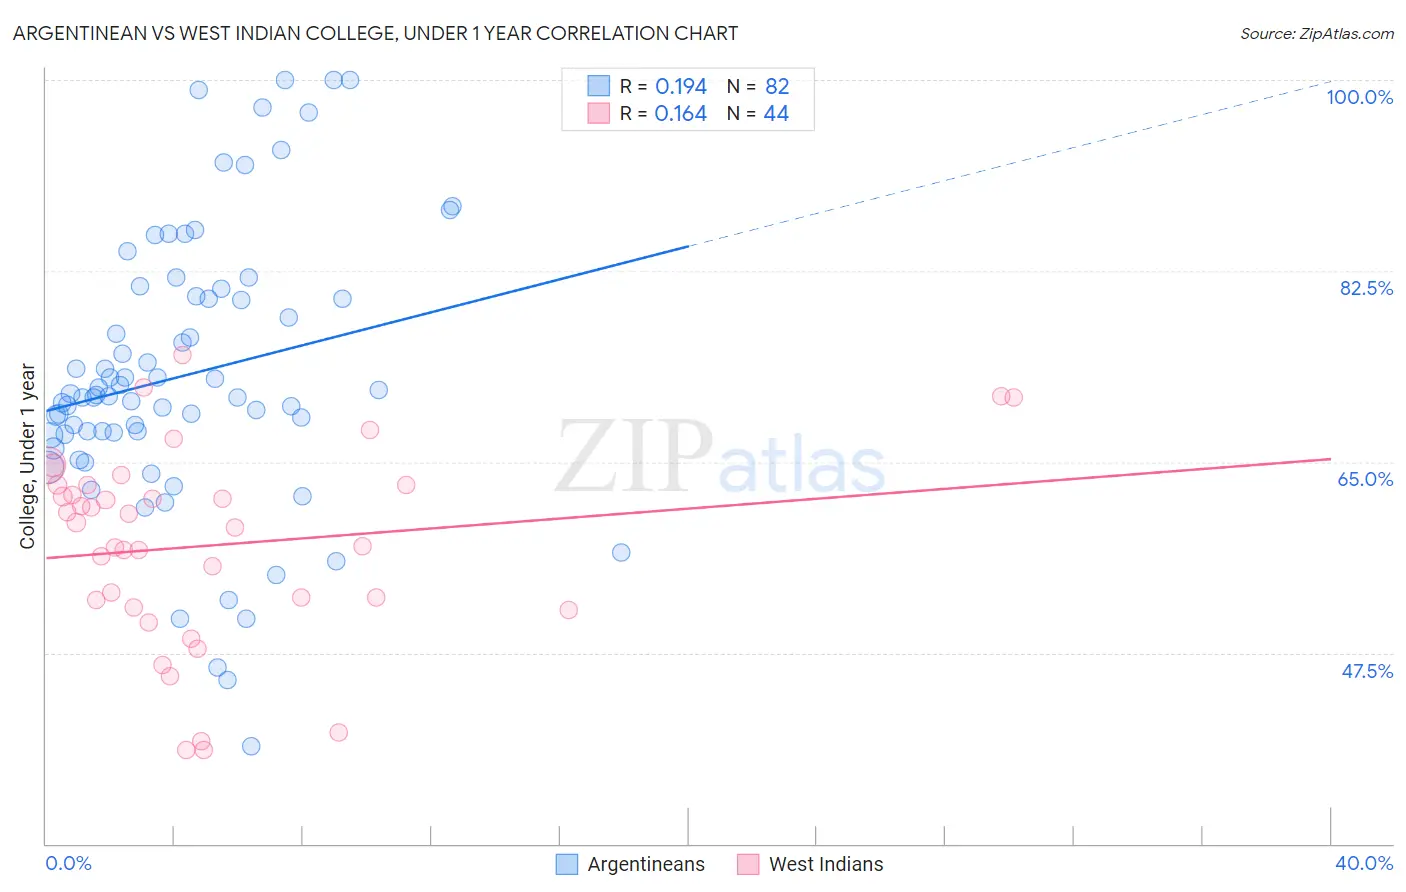
Argentinean vs West Indian College, Under 1 year Correlation Chart
The statistical analysis conducted on geographies consisting of 297,139,739 people shows a poor positive correlation between the proportion of Argentineans and percentage of population with at least college, under 1 year education in the United States with a correlation coefficient (R) of 0.194 and weighted average of 68.4%. Similarly, the statistical analysis conducted on geographies consisting of 254,063,654 people shows a poor positive correlation between the proportion of West Indians and percentage of population with at least college, under 1 year education in the United States with a correlation coefficient (R) of 0.164 and weighted average of 61.5%, a difference of 11.2%.
College, Under 1 year Correlation Summary
| Measurement | Argentinean | West Indian |
| Minimum | 38.9% | 38.5% |
| Maximum | 100.0% | 74.8% |
| Range | 61.1% | 36.3% |
| Mean | 73.0% | 57.4% |
| Median | 71.1% | 59.2% |
| Interquartile 25% (IQ1) | 67.5% | 52.0% |
| Interquartile 75% (IQ3) | 80.2% | 62.9% |
| Interquartile Range (IQR) | 12.7% | 10.8% |
| Standard Deviation (Sample) | 12.8% | 8.9% |
| Standard Deviation (Population) | 12.7% | 8.8% |
Similar Demographics by College, Under 1 year
Demographics Similar to Argentineans by College, Under 1 year
In terms of college, under 1 year, the demographic groups most similar to Argentineans are Norwegian (68.4%, a difference of 0.020%), Immigrants from Hungary (68.3%, a difference of 0.020%), Egyptian (68.3%, a difference of 0.030%), Immigrants from Lebanon (68.3%, a difference of 0.030%), and Chinese (68.3%, a difference of 0.050%).
| Demographics | Rating | Rank | College, Under 1 year |
| Laotians | 98.6 /100 | #76 | Exceptional 68.5% |
| British | 98.6 /100 | #77 | Exceptional 68.5% |
| Danes | 98.6 /100 | #78 | Exceptional 68.5% |
| Greeks | 98.6 /100 | #79 | Exceptional 68.5% |
| Immigrants | Spain | 98.5 /100 | #80 | Exceptional 68.4% |
| Immigrants | Greece | 98.5 /100 | #81 | Exceptional 68.4% |
| Norwegians | 98.4 /100 | #82 | Exceptional 68.4% |
| Argentineans | 98.4 /100 | #83 | Exceptional 68.4% |
| Immigrants | Hungary | 98.3 /100 | #84 | Exceptional 68.3% |
| Egyptians | 98.3 /100 | #85 | Exceptional 68.3% |
| Immigrants | Lebanon | 98.3 /100 | #86 | Exceptional 68.3% |
| Chinese | 98.3 /100 | #87 | Exceptional 68.3% |
| Croatians | 98.2 /100 | #88 | Exceptional 68.3% |
| Ethiopians | 98.2 /100 | #89 | Exceptional 68.3% |
| Icelanders | 98.1 /100 | #90 | Exceptional 68.3% |
Demographics Similar to West Indians by College, Under 1 year
In terms of college, under 1 year, the demographic groups most similar to West Indians are Japanese (61.5%, a difference of 0.0%), Immigrants from Cambodia (61.5%, a difference of 0.0%), Immigrants from Micronesia (61.5%, a difference of 0.11%), Comanche (61.4%, a difference of 0.13%), and Bangladeshi (61.4%, a difference of 0.17%).
| Demographics | Rating | Rank | College, Under 1 year |
| Delaware | 0.9 /100 | #245 | Tragic 62.1% |
| Marshallese | 0.8 /100 | #246 | Tragic 61.9% |
| Immigrants | Liberia | 0.8 /100 | #247 | Tragic 61.9% |
| Potawatomi | 0.6 /100 | #248 | Tragic 61.8% |
| Vietnamese | 0.5 /100 | #249 | Tragic 61.7% |
| Immigrants | Congo | 0.5 /100 | #250 | Tragic 61.7% |
| Immigrants | Micronesia | 0.5 /100 | #251 | Tragic 61.5% |
| West Indians | 0.4 /100 | #252 | Tragic 61.5% |
| Japanese | 0.4 /100 | #253 | Tragic 61.5% |
| Immigrants | Cambodia | 0.4 /100 | #254 | Tragic 61.5% |
| Comanche | 0.4 /100 | #255 | Tragic 61.4% |
| Bangladeshis | 0.4 /100 | #256 | Tragic 61.4% |
| Immigrants | Laos | 0.3 /100 | #257 | Tragic 61.3% |
| Immigrants | Bangladesh | 0.3 /100 | #258 | Tragic 61.3% |
| Indonesians | 0.3 /100 | #259 | Tragic 61.2% |