Austrian vs Immigrants from Iran 10th Grade

COMPARE

Austrian
Race
Ancestry
AfghanAfricanAlaska NativeAlaskan AthabascanAlbanianAleutAlsatianAmericanApacheArabArapahoArgentineanArmenianAssyrian/Chaldean/SyriacAustralianAustrianBahamianBangladeshiBarbadianBasqueBelgianBelizeanBermudanBhutaneseBlackfeetBolivianBrazilianBritishBritish West IndianBulgarianBurmeseCajunCambodianCanadianCape VerdeanCarpatho RusynCelticCentral AmericanCentral American IndianCherokeeCheyenneChickasawChileanChineseChippewaChoctawColombianColvilleComancheCosta RicanCreeCreekCroatianCrowCubanCypriotCzechCzechoslovakianDanishDelawareDominicanDutchDutch West IndianEastern EuropeanEcuadorianEgyptianEnglishEstonianEthiopianEuropeanFijianFilipinoFinnishFrenchFrench American IndianFrench CanadianGermanGerman RussianGhanaianGreekGuamanian/ChamorroGuatemalanGuyaneseHaitianHmongHonduranHopiHoumaHungarianIcelanderIndian (Asian)IndonesianInupiatIranianIraqiIrishIroquoisIsraeliItalianJamaicanJapaneseJordanianKenyanKiowaKoreanLaotianLatvianLebaneseLiberianLithuanianLumbeeLuxembourgerMacedonianMalaysianMalteseMarshalleseMenomineeMexicanMexican American IndianMongolianMoroccanNative HawaiianNavajoNepaleseNew ZealanderNicaraguanNigerianNorthern EuropeanNorwegianOkinawanOsageOttawaPaiutePakistaniPalestinianPanamanianParaguayanPennsylvania GermanPeruvianPimaPolishPortuguesePotawatomiPuebloPuerto RicanPuget Sound SalishRomanianRussianSalvadoranSamoanScandinavianScotch-IrishScottishSeminoleSenegaleseSerbianShoshoneSierra LeoneanSiouxSlavicSlovakSloveneSomaliSouth AfricanSouth AmericanSouth American IndianSoviet UnionSpaniardSpanishSpanish AmericanSpanish American IndianSri LankanSubsaharan AfricanSudaneseSwedishSwissSyrianTaiwaneseThaiTlingit-HaidaTohono O'OdhamTonganTrinidadian and TobagonianTsimshianTurkishU.S. Virgin IslanderUgandanUkrainianUruguayanUteVenezuelanVietnameseWelshWest IndianYakamaYaquiYugoslavianYumanYup'ikZimbabwean
Immigration
NonimmigrantsImmigrantsAfghanistanAfricaAlbaniaArgentinaArmeniaAsiaAustraliaAustriaBahamasBangladeshBarbadosBelarusBelgiumBelizeBoliviaBosnia and HerzegovinaBrazilBulgariaBurma/MyanmarCabo VerdeCambodiaCameroonCanadaCaribbeanCentral AmericaChileChinaColombiaCongoCosta RicaCroatiaCubaCzechoslovakiaDenmarkDominicaDominican RepublicEastern AfricaEastern AsiaEastern EuropeEcuadorEgyptEl SalvadorEnglandEritreaEthiopiaEuropeFijiFranceGermanyGhanaGreeceGrenadaGuatemalaGuyanaHaitiHondurasHong KongHungaryIndiaIndonesiaIraqIrelandIsraelItalyJamaicaJapanJordanKazakhstanKenyaKoreaKuwaitLaosLatin AmericaLatviaLebanonLiberiaLithuaniaMalaysiaMexicoMicronesiaMiddle AfricaMoldovaMoroccoNepalNetherlandsNicaraguaNigeriaNorth AmericaNorth MacedoniaNorthern AfricaNorthern EuropeNorwayOceaniaPakistanPanamaPeruPhilippinesPolandPortugalRomaniaRussiaSaudi ArabiaScotlandSenegalSerbiaSierra LeoneSingaporeSomaliaSouth AfricaSouth AmericaSouth Central AsiaSouth Eastern AsiaSouthern EuropeSpainSri LankaSt. Vincent and the GrenadinesSudanSwedenSwitzerlandSyriaTaiwanThailandTrinidad and TobagoTurkeyUgandaUkraineUruguayUzbekistanVenezuelaVietnamWest IndiesWestern AfricaWestern AsiaWestern EuropeYemenZaireZimbabweAzores
Immigrants from Iran
Race
Ancestry
AfghanAfricanAlaska NativeAlaskan AthabascanAlbanianAleutAlsatianAmericanApacheArabArapahoArgentineanArmenianAssyrian/Chaldean/SyriacAustralianBahamianBangladeshiBarbadianBasqueBelgianBelizeanBermudanBhutaneseBlackfeetBolivianBrazilianBritishBritish West IndianBulgarianBurmeseCajunCambodianCanadianCape VerdeanCarpatho RusynCelticCentral AmericanCentral American IndianCherokeeCheyenneChickasawChileanChineseChippewaChoctawColombianColvilleComancheCosta RicanCreeCreekCroatianCrowCubanCypriotCzechCzechoslovakianDanishDelawareDominicanDutchDutch West IndianEastern EuropeanEcuadorianEgyptianEnglishEstonianEthiopianEuropeanFijianFilipinoFinnishFrenchFrench American IndianFrench CanadianGermanGerman RussianGhanaianGreekGuamanian/ChamorroGuatemalanGuyaneseHaitianHmongHonduranHopiHoumaHungarianIcelanderIndian (Asian)IndonesianInupiatIranianIraqiIrishIroquoisIsraeliItalianJamaicanJapaneseJordanianKenyanKiowaKoreanLaotianLatvianLebaneseLiberianLithuanianLumbeeLuxembourgerMacedonianMalaysianMalteseMarshalleseMenomineeMexicanMexican American IndianMongolianMoroccanNative HawaiianNavajoNepaleseNew ZealanderNicaraguanNigerianNorthern EuropeanNorwegianOkinawanOsageOttawaPaiutePakistaniPalestinianPanamanianParaguayanPennsylvania GermanPeruvianPimaPolishPortuguesePotawatomiPuebloPuerto RicanPuget Sound SalishRomanianRussianSalvadoranSamoanScandinavianScotch-IrishScottishSeminoleSenegaleseSerbianShoshoneSierra LeoneanSiouxSlavicSlovakSloveneSomaliSouth AfricanSouth AmericanSouth American IndianSoviet UnionSpaniardSpanishSpanish AmericanSpanish American IndianSri LankanSubsaharan AfricanSudaneseSwedishSwissSyrianTaiwaneseThaiTlingit-HaidaTohono O'OdhamTonganTrinidadian and TobagonianTsimshianTurkishU.S. Virgin IslanderUgandanUkrainianUruguayanUteVenezuelanVietnameseWelshWest IndianYakamaYaquiYugoslavianYumanYup'ikZimbabwean
Immigration
NonimmigrantsImmigrantsAfghanistanAfricaAlbaniaArgentinaArmeniaAsiaAustraliaAustriaBahamasBangladeshBarbadosBelarusBelgiumBelizeBoliviaBosnia and HerzegovinaBrazilBulgariaBurma/MyanmarCabo VerdeCambodiaCameroonCanadaCaribbeanCentral AmericaChileChinaColombiaCongoCosta RicaCroatiaCubaCzechoslovakiaDenmarkDominicaDominican RepublicEastern AfricaEastern AsiaEastern EuropeEcuadorEgyptEl SalvadorEnglandEritreaEthiopiaEuropeFijiFranceGermanyGhanaGreeceGrenadaGuatemalaGuyanaHaitiHondurasHong KongHungaryIndiaIndonesiaIranIraqIrelandIsraelItalyJamaicaJapanJordanKazakhstanKenyaKoreaKuwaitLaosLatin AmericaLatviaLebanonLiberiaLithuaniaMalaysiaMexicoMicronesiaMiddle AfricaMoldovaMoroccoNepalNetherlandsNicaraguaNigeriaNorth AmericaNorth MacedoniaNorthern AfricaNorthern EuropeNorwayOceaniaPakistanPanamaPeruPhilippinesPolandPortugalRomaniaRussiaSaudi ArabiaScotlandSenegalSerbiaSierra LeoneSingaporeSomaliaSouth AfricaSouth AmericaSouth Central AsiaSouth Eastern AsiaSouthern EuropeSpainSri LankaSt. Vincent and the GrenadinesSudanSwedenSwitzerlandSyriaTaiwanThailandTrinidad and TobagoTurkeyUgandaUkraineUruguayUzbekistanVenezuelaVietnamWest IndiesWestern AfricaWestern AsiaWestern EuropeYemenZaireZimbabweAzores
10th Grade
Income
Poverty
Unemployment
Labor Participation
Family Structure
Vehicle Availability
Education Level
Disability

10th Grade Comparison

Austrians

Immigrants from Iran

Exceptional
Exceptional
95.1%
10TH GRADE
99.8/ 100
METRIC RATING
51st/ 347
METRIC RANK
94.3%
10TH GRADE
94.4/ 100
METRIC RATING
126th/ 347
METRIC RANK

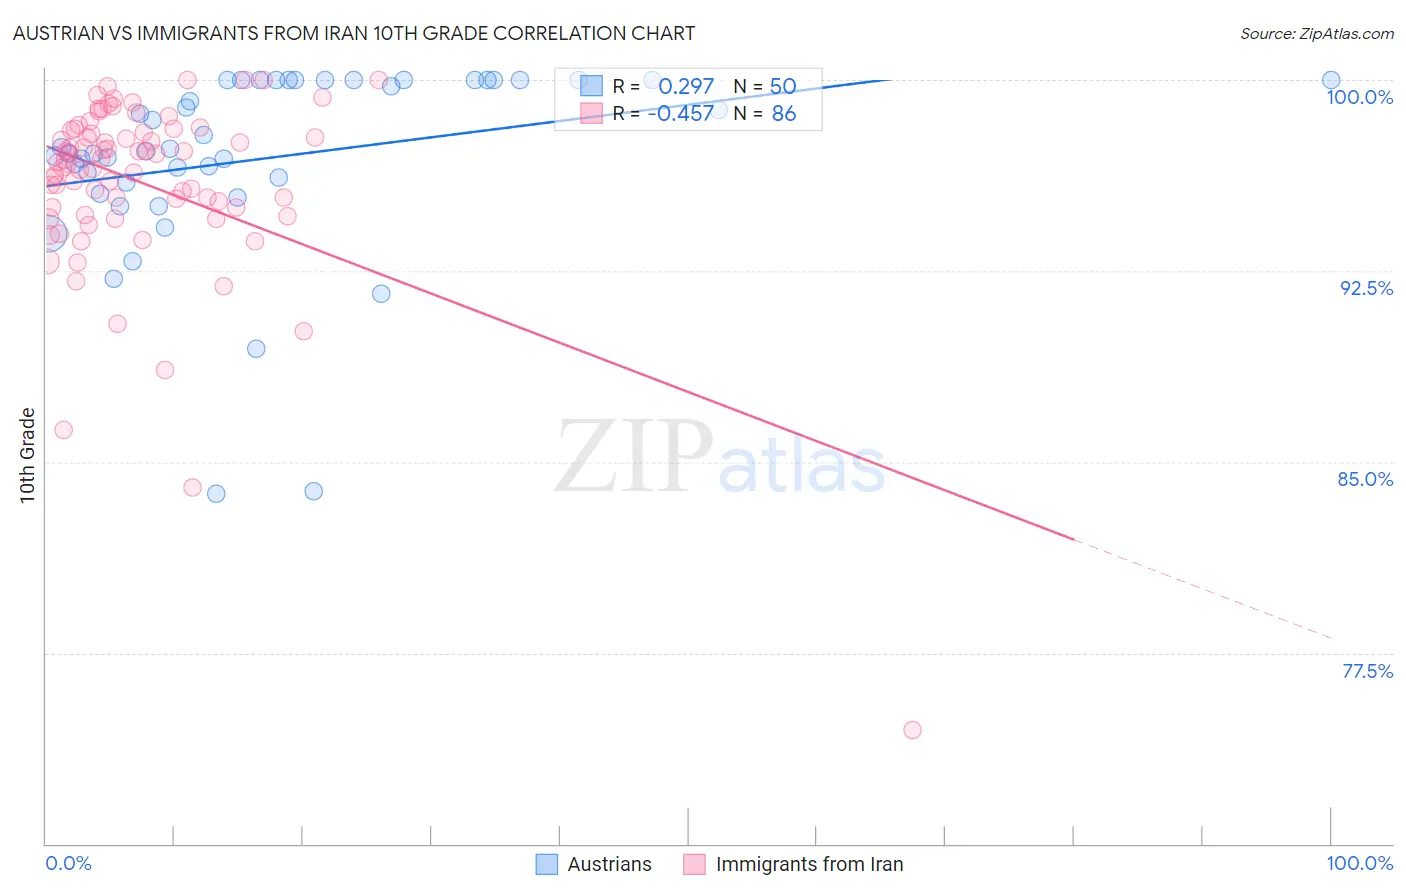
Austrian vs Immigrants from Iran 10th Grade Correlation Chart

The statistical analysis conducted on geographies consisting of 452,082,820 people shows a weak positive correlation between the proportion of Austrians and percentage of population with at least 10th grade education in the United States with a correlation coefficient (R) of 0.297 and weighted average of 95.1%. Similarly, the statistical analysis conducted on geographies consisting of 279,867,553 people shows a moderate negative correlation between the proportion of Immigrants from Iran and percentage of population with at least 10th grade education in the United States with a correlation coefficient (R) of -0.457 and weighted average of 94.3%, a difference of 0.79%.
Austrian vs Immigrants from Iran 10th Grade

10th Grade Correlation Summary

MeasurementAustrianImmigrants from Iran
Minimum83.8%74.5%
Maximum100.0%100.0%
Range16.2%25.5%
Mean96.9%96.0%
Median97.3%96.8%
Interquartile 25% (IQ1)96.0%95.0%
Interquartile 75% (IQ3)100.0%98.0%
Interquartile Range (IQR)4.0%3.0%
Standard Deviation (Sample)3.7%3.7%
Standard Deviation (Population)3.7%3.7%

Similar Demographics by 10th Grade

Demographics Similar to Austrians by 10th Grade

In terms of 10th grade, the demographic groups most similar to Austrians are Ottawa (95.1%, a difference of 0.0%), Immigrants from Canada (95.1%, a difference of 0.010%), Immigrants from North America (95.0%, a difference of 0.010%), Immigrants from Austria (95.1%, a difference of 0.030%), and Immigrants from Lithuania (95.0%, a difference of 0.030%).
DemographicsRating | Rank10th Grade
Immigrants | Northern Europe
99.9
/100
|
#44
Exceptional
95.2%
Greeks
99.9
/100
|
#45
Exceptional
95.2%
Czechoslovakians
99.9
/100
|
#46
Exceptional
95.1%
Serbians
99.9
/100
|
#47
Exceptional
95.1%
Australians
99.9
/100
|
#48
Exceptional
95.1%
Immigrants | Austria
99.9
/100
|
#49
Exceptional
95.1%
Immigrants | Canada
99.8
/100
|
#50
Exceptional
95.1%
Austrians
99.8
/100
|
#51
Exceptional
95.1%
Ottawa
99.8
/100
|
#52
Exceptional
95.1%
Immigrants | North America
99.8
/100
|
#53
Exceptional
95.0%
Immigrants | Lithuania
99.8
/100
|
#54
Exceptional
95.0%
Immigrants | Ireland
99.8
/100
|
#55
Exceptional
95.0%
New Zealanders
99.8
/100
|
#56
Exceptional
95.0%
Ukrainians
99.8
/100
|
#57
Exceptional
95.0%
Aleuts
99.8
/100
|
#58
Exceptional
95.0%

Demographics Similar to Immigrants from Iran by 10th Grade

In terms of 10th grade, the demographic groups most similar to Immigrants from Iran are American (94.3%, a difference of 0.0%), Basque (94.3%, a difference of 0.020%), Israeli (94.3%, a difference of 0.020%), Inupiat (94.4%, a difference of 0.030%), and Cree (94.4%, a difference of 0.030%).
DemographicsRating | Rank10th Grade
Immigrants | Israel
95.4
/100
|
#119
Exceptional
94.4%
Immigrants | Taiwan
95.3
/100
|
#120
Exceptional
94.4%
Immigrants | Belarus
95.2
/100
|
#121
Exceptional
94.4%
Inupiat
95.1
/100
|
#122
Exceptional
94.4%
Cree
95.1
/100
|
#123
Exceptional
94.4%
Basques
94.9
/100
|
#124
Exceptional
94.3%
Americans
94.4
/100
|
#125
Exceptional
94.3%
Immigrants | Iran
94.4
/100
|
#126
Exceptional
94.3%
Israelis
93.8
/100
|
#127
Exceptional
94.3%
Potawatomi
93.6
/100
|
#128
Exceptional
94.3%
Iroquois
92.8
/100
|
#129
Exceptional
94.3%
Immigrants | Greece
92.7
/100
|
#130
Exceptional
94.3%
Immigrants | Eastern Europe
92.5
/100
|
#131
Exceptional
94.3%
Immigrants | Russia
92.4
/100
|
#132
Exceptional
94.3%
Creek
91.9
/100
|
#133
Exceptional
94.2%