Immigrants from Congo vs Immigrants from China 10th Grade
COMPARE
Immigrants from Congo
Immigrants from China
10th Grade
10th Grade Comparison
Immigrants from Congo
Immigrants from China
92.4%
10TH GRADE
0.2/ 100
METRIC RATING
274th/ 347
METRIC RANK
93.2%
10TH GRADE
5.9/ 100
METRIC RATING
228th/ 347
METRIC RANK
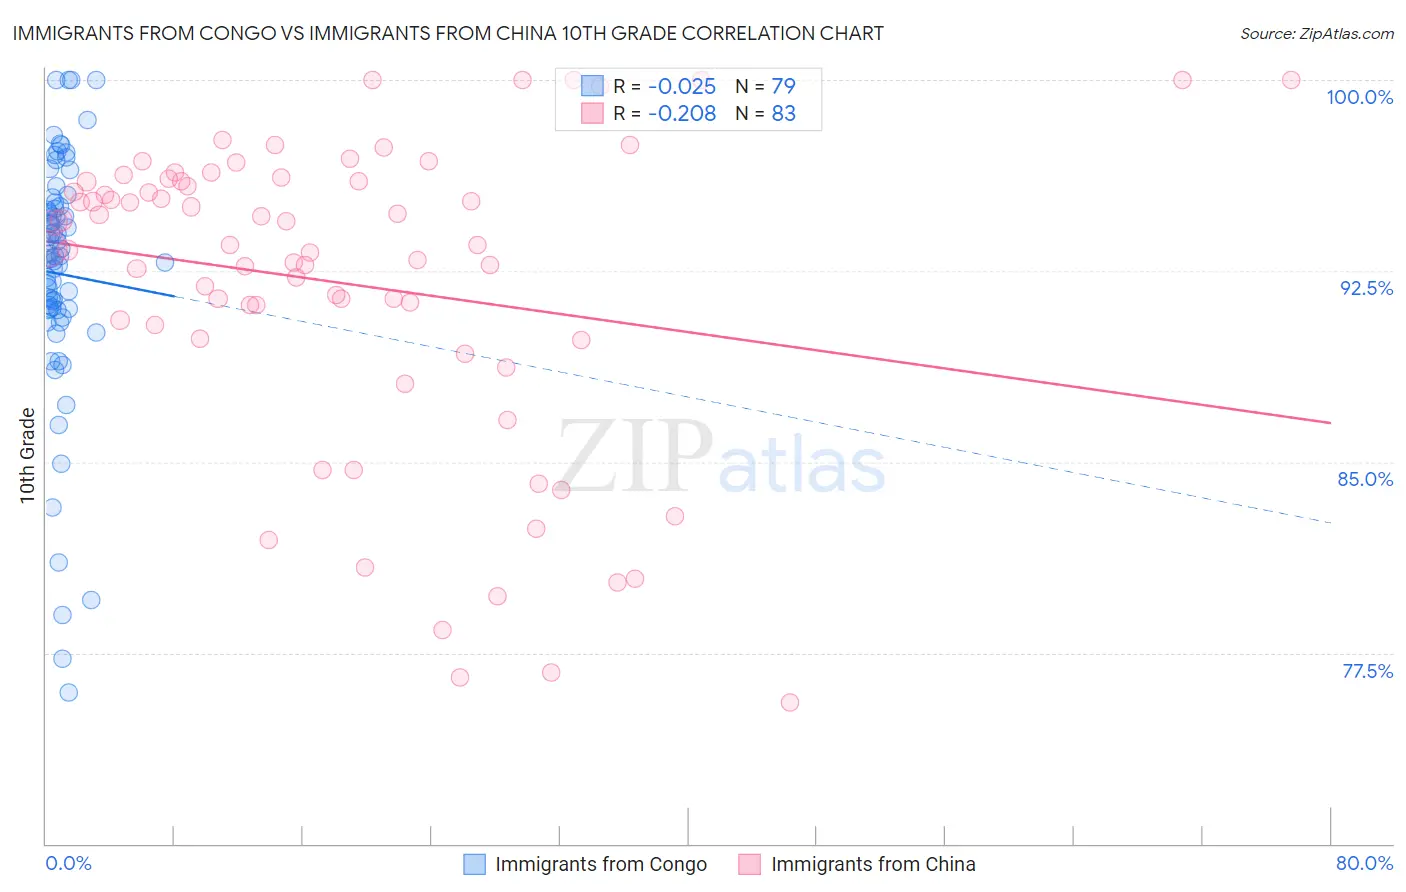
Immigrants from Congo vs Immigrants from China 10th Grade Correlation Chart
The statistical analysis conducted on geographies consisting of 92,131,505 people shows no correlation between the proportion of Immigrants from Congo and percentage of population with at least 10th grade education in the United States with a correlation coefficient (R) of -0.025 and weighted average of 92.4%. Similarly, the statistical analysis conducted on geographies consisting of 457,082,957 people shows a weak negative correlation between the proportion of Immigrants from China and percentage of population with at least 10th grade education in the United States with a correlation coefficient (R) of -0.208 and weighted average of 93.2%, a difference of 0.77%.
10th Grade Correlation Summary
| Measurement | Immigrants from Congo | Immigrants from China |
| Minimum | 75.9% | 75.5% |
| Maximum | 100.0% | 100.0% |
| Range | 24.1% | 24.5% |
| Mean | 92.4% | 92.0% |
| Median | 93.1% | 93.5% |
| Interquartile 25% (IQ1) | 91.0% | 89.9% |
| Interquartile 75% (IQ3) | 95.1% | 96.0% |
| Interquartile Range (IQR) | 4.1% | 6.2% |
| Standard Deviation (Sample) | 4.9% | 6.1% |
| Standard Deviation (Population) | 4.9% | 6.1% |
Similar Demographics by 10th Grade
Demographics Similar to Immigrants from Congo by 10th Grade
In terms of 10th grade, the demographic groups most similar to Immigrants from Congo are West Indian (92.4%, a difference of 0.0%), Trinidadian and Tobagonian (92.4%, a difference of 0.010%), Immigrants from Western Africa (92.5%, a difference of 0.080%), Immigrants from Eritrea (92.5%, a difference of 0.090%), and Immigrants from Colombia (92.5%, a difference of 0.10%).
| Demographics | Rating | Rank | 10th Grade |
| Taiwanese | 0.3 /100 | #267 | Tragic 92.5% |
| Immigrants | Ghana | 0.3 /100 | #268 | Tragic 92.5% |
| Immigrants | Colombia | 0.3 /100 | #269 | Tragic 92.5% |
| Immigrants | Uruguay | 0.3 /100 | #270 | Tragic 92.5% |
| Immigrants | Eritrea | 0.3 /100 | #271 | Tragic 92.5% |
| Immigrants | Western Africa | 0.3 /100 | #272 | Tragic 92.5% |
| Trinidadians and Tobagonians | 0.2 /100 | #273 | Tragic 92.4% |
| Immigrants | Congo | 0.2 /100 | #274 | Tragic 92.4% |
| West Indians | 0.2 /100 | #275 | Tragic 92.4% |
| Immigrants | Trinidad and Tobago | 0.1 /100 | #276 | Tragic 92.3% |
| Navajo | 0.1 /100 | #277 | Tragic 92.3% |
| Barbadians | 0.1 /100 | #278 | Tragic 92.2% |
| Natives/Alaskans | 0.1 /100 | #279 | Tragic 92.2% |
| Malaysians | 0.1 /100 | #280 | Tragic 92.2% |
| Bangladeshis | 0.1 /100 | #281 | Tragic 92.2% |
Demographics Similar to Immigrants from China by 10th Grade
In terms of 10th grade, the demographic groups most similar to Immigrants from China are Somali (93.2%, a difference of 0.010%), Korean (93.2%, a difference of 0.010%), Black/African American (93.2%, a difference of 0.010%), Bolivian (93.2%, a difference of 0.030%), and Immigrants from Ethiopia (93.1%, a difference of 0.030%).
| Demographics | Rating | Rank | 10th Grade |
| Immigrants | Southern Europe | 8.9 /100 | #221 | Tragic 93.2% |
| Ethiopians | 7.9 /100 | #222 | Tragic 93.2% |
| Immigrants | Sierra Leone | 7.6 /100 | #223 | Tragic 93.2% |
| Bolivians | 6.7 /100 | #224 | Tragic 93.2% |
| Somalis | 6.2 /100 | #225 | Tragic 93.2% |
| Koreans | 6.1 /100 | #226 | Tragic 93.2% |
| Blacks/African Americans | 6.0 /100 | #227 | Tragic 93.2% |
| Immigrants | China | 5.9 /100 | #228 | Tragic 93.2% |
| Immigrants | Ethiopia | 5.1 /100 | #229 | Tragic 93.1% |
| Immigrants | Africa | 5.0 /100 | #230 | Tragic 93.1% |
| South American Indians | 4.9 /100 | #231 | Tragic 93.1% |
| Bahamians | 4.9 /100 | #232 | Tragic 93.1% |
| Comanche | 4.9 /100 | #233 | Tragic 93.1% |
| Sub-Saharan Africans | 4.7 /100 | #234 | Tragic 93.1% |
| Africans | 4.6 /100 | #235 | Tragic 93.1% |