Austrian vs Immigrants from Uganda 10th Grade
COMPARE
Austrian
Immigrants from Uganda
10th Grade
10th Grade Comparison
Austrians
Immigrants from Uganda
95.1%
10TH GRADE
99.8/ 100
METRIC RATING
51st/ 347
METRIC RANK
93.5%
10TH GRADE
20.9/ 100
METRIC RATING
202nd/ 347
METRIC RANK
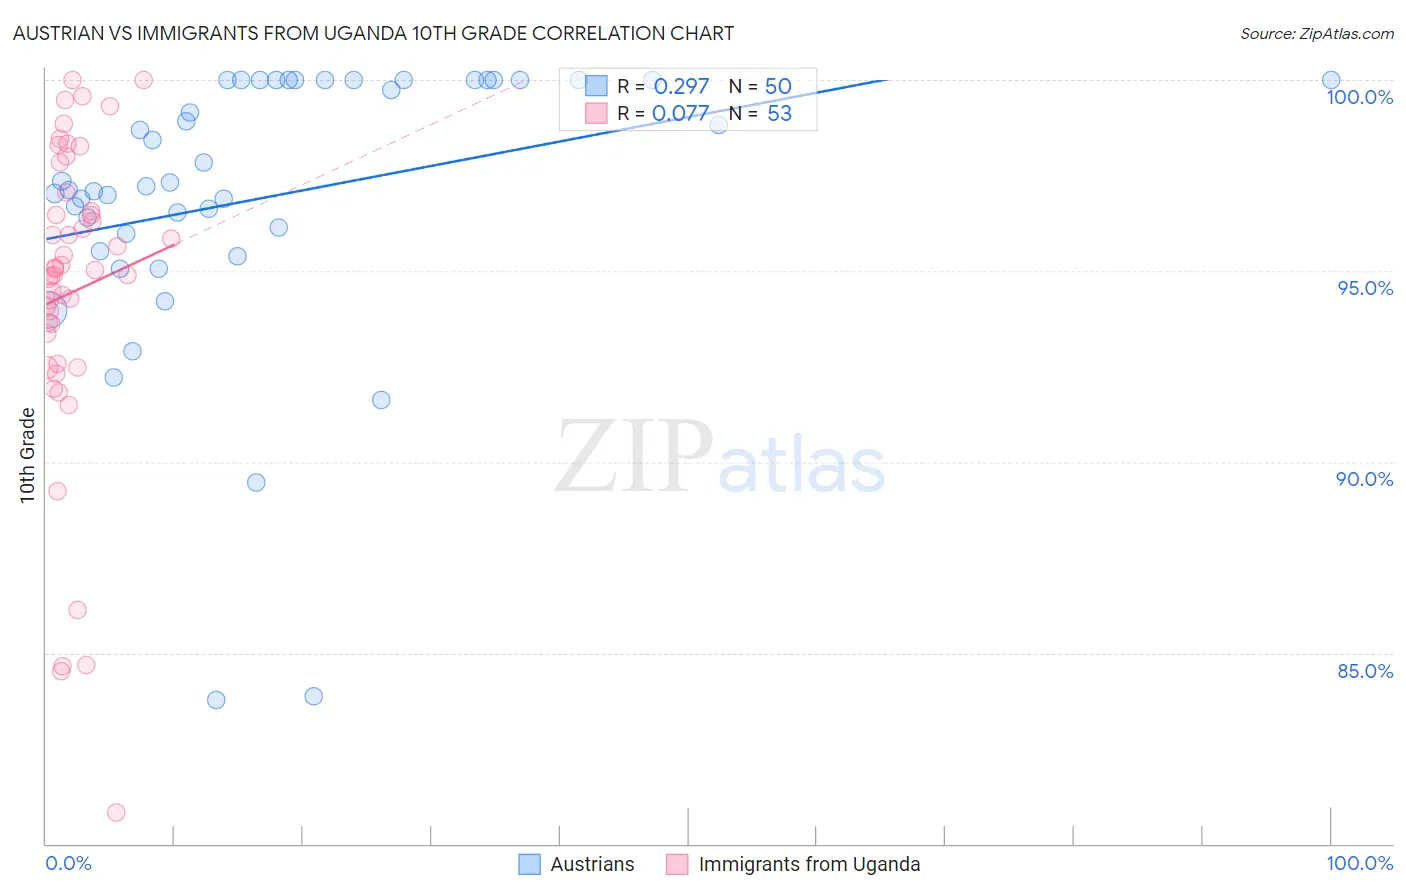
Austrian vs Immigrants from Uganda 10th Grade Correlation Chart
The statistical analysis conducted on geographies consisting of 452,082,820 people shows a weak positive correlation between the proportion of Austrians and percentage of population with at least 10th grade education in the United States with a correlation coefficient (R) of 0.297 and weighted average of 95.1%. Similarly, the statistical analysis conducted on geographies consisting of 125,970,180 people shows a slight positive correlation between the proportion of Immigrants from Uganda and percentage of population with at least 10th grade education in the United States with a correlation coefficient (R) of 0.077 and weighted average of 93.5%, a difference of 1.7%.
10th Grade Correlation Summary
| Measurement | Austrian | Immigrants from Uganda |
| Minimum | 83.8% | 80.8% |
| Maximum | 100.0% | 100.0% |
| Range | 16.2% | 19.2% |
| Mean | 96.9% | 94.4% |
| Median | 97.3% | 95.0% |
| Interquartile 25% (IQ1) | 96.0% | 93.0% |
| Interquartile 75% (IQ3) | 100.0% | 96.8% |
| Interquartile Range (IQR) | 4.0% | 3.8% |
| Standard Deviation (Sample) | 3.7% | 4.1% |
| Standard Deviation (Population) | 3.7% | 4.1% |
Similar Demographics by 10th Grade
Demographics Similar to Austrians by 10th Grade
In terms of 10th grade, the demographic groups most similar to Austrians are Ottawa (95.1%, a difference of 0.0%), Immigrants from Canada (95.1%, a difference of 0.010%), Immigrants from North America (95.0%, a difference of 0.010%), Immigrants from Austria (95.1%, a difference of 0.030%), and Immigrants from Lithuania (95.0%, a difference of 0.030%).
| Demographics | Rating | Rank | 10th Grade |
| Immigrants | Northern Europe | 99.9 /100 | #44 | Exceptional 95.2% |
| Greeks | 99.9 /100 | #45 | Exceptional 95.2% |
| Czechoslovakians | 99.9 /100 | #46 | Exceptional 95.1% |
| Serbians | 99.9 /100 | #47 | Exceptional 95.1% |
| Australians | 99.9 /100 | #48 | Exceptional 95.1% |
| Immigrants | Austria | 99.9 /100 | #49 | Exceptional 95.1% |
| Immigrants | Canada | 99.8 /100 | #50 | Exceptional 95.1% |
| Austrians | 99.8 /100 | #51 | Exceptional 95.1% |
| Ottawa | 99.8 /100 | #52 | Exceptional 95.1% |
| Immigrants | North America | 99.8 /100 | #53 | Exceptional 95.0% |
| Immigrants | Lithuania | 99.8 /100 | #54 | Exceptional 95.0% |
| Immigrants | Ireland | 99.8 /100 | #55 | Exceptional 95.0% |
| New Zealanders | 99.8 /100 | #56 | Exceptional 95.0% |
| Ukrainians | 99.8 /100 | #57 | Exceptional 95.0% |
| Aleuts | 99.8 /100 | #58 | Exceptional 95.0% |
Demographics Similar to Immigrants from Uganda by 10th Grade
In terms of 10th grade, the demographic groups most similar to Immigrants from Uganda are Hawaiian (93.5%, a difference of 0.010%), Immigrants from Western Asia (93.4%, a difference of 0.010%), Ute (93.4%, a difference of 0.010%), Immigrants from Indonesia (93.4%, a difference of 0.010%), and Immigrants from Sudan (93.4%, a difference of 0.010%).
| Demographics | Rating | Rank | 10th Grade |
| Cheyenne | 26.8 /100 | #195 | Fair 93.5% |
| Moroccans | 25.3 /100 | #196 | Fair 93.5% |
| Pueblo | 23.9 /100 | #197 | Fair 93.5% |
| Immigrants | Micronesia | 23.2 /100 | #198 | Fair 93.5% |
| Asians | 23.0 /100 | #199 | Fair 93.5% |
| Hopi | 22.2 /100 | #200 | Fair 93.5% |
| Hawaiians | 21.8 /100 | #201 | Fair 93.5% |
| Immigrants | Uganda | 20.9 /100 | #202 | Fair 93.5% |
| Immigrants | Western Asia | 20.6 /100 | #203 | Fair 93.4% |
| Ute | 20.3 /100 | #204 | Fair 93.4% |
| Immigrants | Indonesia | 20.2 /100 | #205 | Fair 93.4% |
| Immigrants | Sudan | 20.0 /100 | #206 | Fair 93.4% |
| Samoans | 19.5 /100 | #207 | Poor 93.4% |
| Immigrants | Syria | 19.4 /100 | #208 | Poor 93.4% |
| Immigrants | Chile | 18.8 /100 | #209 | Poor 93.4% |