Austrian vs Immigrants from Norway 10th Grade
COMPARE
Austrian
Immigrants from Norway
10th Grade
10th Grade Comparison
Austrians
Immigrants from Norway
95.1%
10TH GRADE
99.8/ 100
METRIC RATING
51st/ 347
METRIC RANK
94.5%
10TH GRADE
97.2/ 100
METRIC RATING
109th/ 347
METRIC RANK
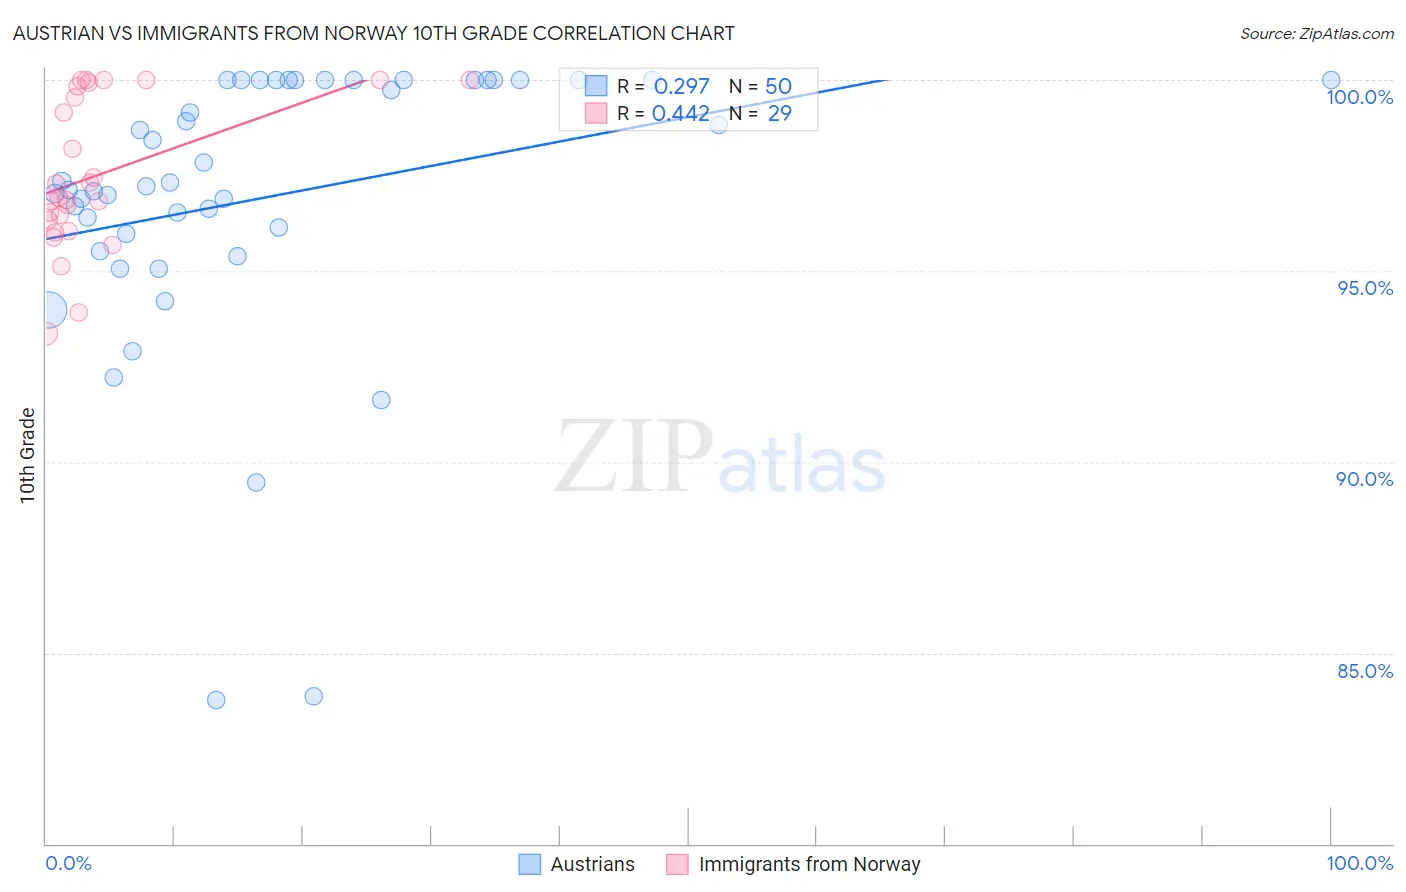
Austrian vs Immigrants from Norway 10th Grade Correlation Chart
The statistical analysis conducted on geographies consisting of 452,082,820 people shows a weak positive correlation between the proportion of Austrians and percentage of population with at least 10th grade education in the United States with a correlation coefficient (R) of 0.297 and weighted average of 95.1%. Similarly, the statistical analysis conducted on geographies consisting of 116,716,420 people shows a moderate positive correlation between the proportion of Immigrants from Norway and percentage of population with at least 10th grade education in the United States with a correlation coefficient (R) of 0.442 and weighted average of 94.5%, a difference of 0.62%.
10th Grade Correlation Summary
| Measurement | Austrian | Immigrants from Norway |
| Minimum | 83.8% | 93.4% |
| Maximum | 100.0% | 100.0% |
| Range | 16.2% | 6.6% |
| Mean | 96.9% | 97.5% |
| Median | 97.3% | 96.9% |
| Interquartile 25% (IQ1) | 96.0% | 96.2% |
| Interquartile 75% (IQ3) | 100.0% | 99.9% |
| Interquartile Range (IQR) | 4.0% | 3.7% |
| Standard Deviation (Sample) | 3.7% | 2.0% |
| Standard Deviation (Population) | 3.7% | 1.9% |
Similar Demographics by 10th Grade
Demographics Similar to Austrians by 10th Grade
In terms of 10th grade, the demographic groups most similar to Austrians are Ottawa (95.1%, a difference of 0.0%), Immigrants from Canada (95.1%, a difference of 0.010%), Immigrants from North America (95.0%, a difference of 0.010%), Immigrants from Austria (95.1%, a difference of 0.030%), and Immigrants from Lithuania (95.0%, a difference of 0.030%).
| Demographics | Rating | Rank | 10th Grade |
| Immigrants | Northern Europe | 99.9 /100 | #44 | Exceptional 95.2% |
| Greeks | 99.9 /100 | #45 | Exceptional 95.2% |
| Czechoslovakians | 99.9 /100 | #46 | Exceptional 95.1% |
| Serbians | 99.9 /100 | #47 | Exceptional 95.1% |
| Australians | 99.9 /100 | #48 | Exceptional 95.1% |
| Immigrants | Austria | 99.9 /100 | #49 | Exceptional 95.1% |
| Immigrants | Canada | 99.8 /100 | #50 | Exceptional 95.1% |
| Austrians | 99.8 /100 | #51 | Exceptional 95.1% |
| Ottawa | 99.8 /100 | #52 | Exceptional 95.1% |
| Immigrants | North America | 99.8 /100 | #53 | Exceptional 95.0% |
| Immigrants | Lithuania | 99.8 /100 | #54 | Exceptional 95.0% |
| Immigrants | Ireland | 99.8 /100 | #55 | Exceptional 95.0% |
| New Zealanders | 99.8 /100 | #56 | Exceptional 95.0% |
| Ukrainians | 99.8 /100 | #57 | Exceptional 95.0% |
| Aleuts | 99.8 /100 | #58 | Exceptional 95.0% |
Demographics Similar to Immigrants from Norway by 10th Grade
In terms of 10th grade, the demographic groups most similar to Immigrants from Norway are Immigrants from North Macedonia (94.5%, a difference of 0.0%), Immigrants from Serbia (94.5%, a difference of 0.010%), Immigrants from Croatia (94.5%, a difference of 0.010%), Burmese (94.5%, a difference of 0.010%), and Immigrants from Europe (94.5%, a difference of 0.020%).
| Demographics | Rating | Rank | 10th Grade |
| Cambodians | 97.6 /100 | #102 | Exceptional 94.5% |
| Immigrants | Europe | 97.5 /100 | #103 | Exceptional 94.5% |
| Immigrants | Romania | 97.5 /100 | #104 | Exceptional 94.5% |
| Immigrants | Turkey | 97.4 /100 | #105 | Exceptional 94.5% |
| Immigrants | Serbia | 97.4 /100 | #106 | Exceptional 94.5% |
| Immigrants | Croatia | 97.4 /100 | #107 | Exceptional 94.5% |
| Immigrants | North Macedonia | 97.2 /100 | #108 | Exceptional 94.5% |
| Immigrants | Norway | 97.2 /100 | #109 | Exceptional 94.5% |
| Burmese | 97.1 /100 | #110 | Exceptional 94.5% |
| Immigrants | Zimbabwe | 96.8 /100 | #111 | Exceptional 94.4% |
| Immigrants | Kuwait | 96.8 /100 | #112 | Exceptional 94.4% |
| Palestinians | 96.5 /100 | #113 | Exceptional 94.4% |
| German Russians | 96.3 /100 | #114 | Exceptional 94.4% |
| Delaware | 96.3 /100 | #115 | Exceptional 94.4% |
| Sioux | 96.2 /100 | #116 | Exceptional 94.4% |