South American vs Immigrants from China 10th Grade
COMPARE
South American
Immigrants from China
10th Grade
10th Grade Comparison
South Americans
Immigrants from China
92.8%
10TH GRADE
0.9/ 100
METRIC RATING
252nd/ 347
METRIC RANK
93.2%
10TH GRADE
5.9/ 100
METRIC RATING
228th/ 347
METRIC RANK
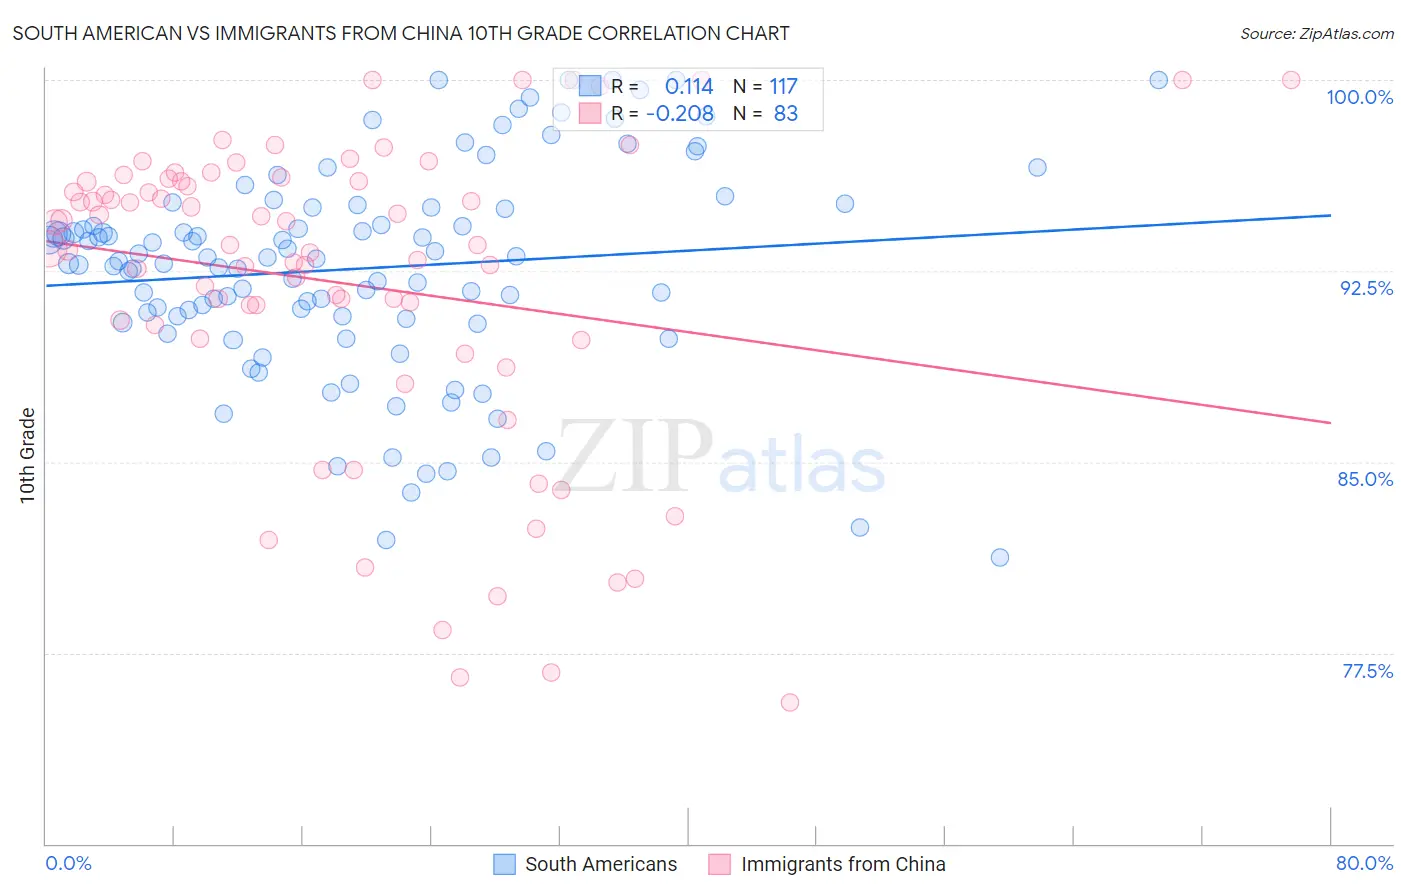
South American vs Immigrants from China 10th Grade Correlation Chart
The statistical analysis conducted on geographies consisting of 494,065,729 people shows a poor positive correlation between the proportion of South Americans and percentage of population with at least 10th grade education in the United States with a correlation coefficient (R) of 0.114 and weighted average of 92.8%. Similarly, the statistical analysis conducted on geographies consisting of 457,082,957 people shows a weak negative correlation between the proportion of Immigrants from China and percentage of population with at least 10th grade education in the United States with a correlation coefficient (R) of -0.208 and weighted average of 93.2%, a difference of 0.43%.
10th Grade Correlation Summary
| Measurement | South American | Immigrants from China |
| Minimum | 81.2% | 75.5% |
| Maximum | 100.0% | 100.0% |
| Range | 18.7% | 24.5% |
| Mean | 92.6% | 92.0% |
| Median | 93.0% | 93.5% |
| Interquartile 25% (IQ1) | 90.7% | 89.9% |
| Interquartile 75% (IQ3) | 95.0% | 96.0% |
| Interquartile Range (IQR) | 4.3% | 6.2% |
| Standard Deviation (Sample) | 4.1% | 6.1% |
| Standard Deviation (Population) | 4.1% | 6.1% |
Similar Demographics by 10th Grade
Demographics Similar to South Americans by 10th Grade
In terms of 10th grade, the demographic groups most similar to South Americans are Ghanaian (92.8%, a difference of 0.0%), Immigrants from Thailand (92.8%, a difference of 0.010%), Armenian (92.7%, a difference of 0.010%), Jamaican (92.8%, a difference of 0.060%), and Immigrants from Bolivia (92.7%, a difference of 0.060%).
| Demographics | Rating | Rank | 10th Grade |
| Uruguayans | 1.8 /100 | #245 | Tragic 92.9% |
| Immigrants | Middle Africa | 1.7 /100 | #246 | Tragic 92.9% |
| Immigrants | Afghanistan | 1.4 /100 | #247 | Tragic 92.8% |
| Colombians | 1.4 /100 | #248 | Tragic 92.8% |
| Immigrants | Senegal | 1.4 /100 | #249 | Tragic 92.8% |
| Jamaicans | 1.2 /100 | #250 | Tragic 92.8% |
| Immigrants | Thailand | 1.0 /100 | #251 | Tragic 92.8% |
| South Americans | 0.9 /100 | #252 | Tragic 92.8% |
| Ghanaians | 0.9 /100 | #253 | Tragic 92.8% |
| Armenians | 0.9 /100 | #254 | Tragic 92.7% |
| Immigrants | Bolivia | 0.7 /100 | #255 | Tragic 92.7% |
| Immigrants | Nigeria | 0.7 /100 | #256 | Tragic 92.7% |
| U.S. Virgin Islanders | 0.7 /100 | #257 | Tragic 92.7% |
| Immigrants | Costa Rica | 0.6 /100 | #258 | Tragic 92.7% |
| Immigrants | Jamaica | 0.5 /100 | #259 | Tragic 92.6% |
Demographics Similar to Immigrants from China by 10th Grade
In terms of 10th grade, the demographic groups most similar to Immigrants from China are Somali (93.2%, a difference of 0.010%), Korean (93.2%, a difference of 0.010%), Black/African American (93.2%, a difference of 0.010%), Bolivian (93.2%, a difference of 0.030%), and Immigrants from Ethiopia (93.1%, a difference of 0.030%).
| Demographics | Rating | Rank | 10th Grade |
| Immigrants | Southern Europe | 8.9 /100 | #221 | Tragic 93.2% |
| Ethiopians | 7.9 /100 | #222 | Tragic 93.2% |
| Immigrants | Sierra Leone | 7.6 /100 | #223 | Tragic 93.2% |
| Bolivians | 6.7 /100 | #224 | Tragic 93.2% |
| Somalis | 6.2 /100 | #225 | Tragic 93.2% |
| Koreans | 6.1 /100 | #226 | Tragic 93.2% |
| Blacks/African Americans | 6.0 /100 | #227 | Tragic 93.2% |
| Immigrants | China | 5.9 /100 | #228 | Tragic 93.2% |
| Immigrants | Ethiopia | 5.1 /100 | #229 | Tragic 93.1% |
| Immigrants | Africa | 5.0 /100 | #230 | Tragic 93.1% |
| South American Indians | 4.9 /100 | #231 | Tragic 93.1% |
| Bahamians | 4.9 /100 | #232 | Tragic 93.1% |
| Comanche | 4.9 /100 | #233 | Tragic 93.1% |
| Sub-Saharan Africans | 4.7 /100 | #234 | Tragic 93.1% |
| Africans | 4.6 /100 | #235 | Tragic 93.1% |