Austrian vs Ghanaian Seniors Poverty Over the Age of 65
COMPARE
Austrian
Ghanaian
Seniors Poverty Over the Age of 65
Seniors Poverty Over the Age of 65 Comparison
Austrians
Ghanaians
9.6%
SENIORS POVERTY OVER THE AGE OF 65
99.5/ 100
METRIC RATING
44th/ 347
METRIC RANK
12.4%
SENIORS POVERTY OVER THE AGE OF 65
0.2/ 100
METRIC RATING
259th/ 347
METRIC RANK
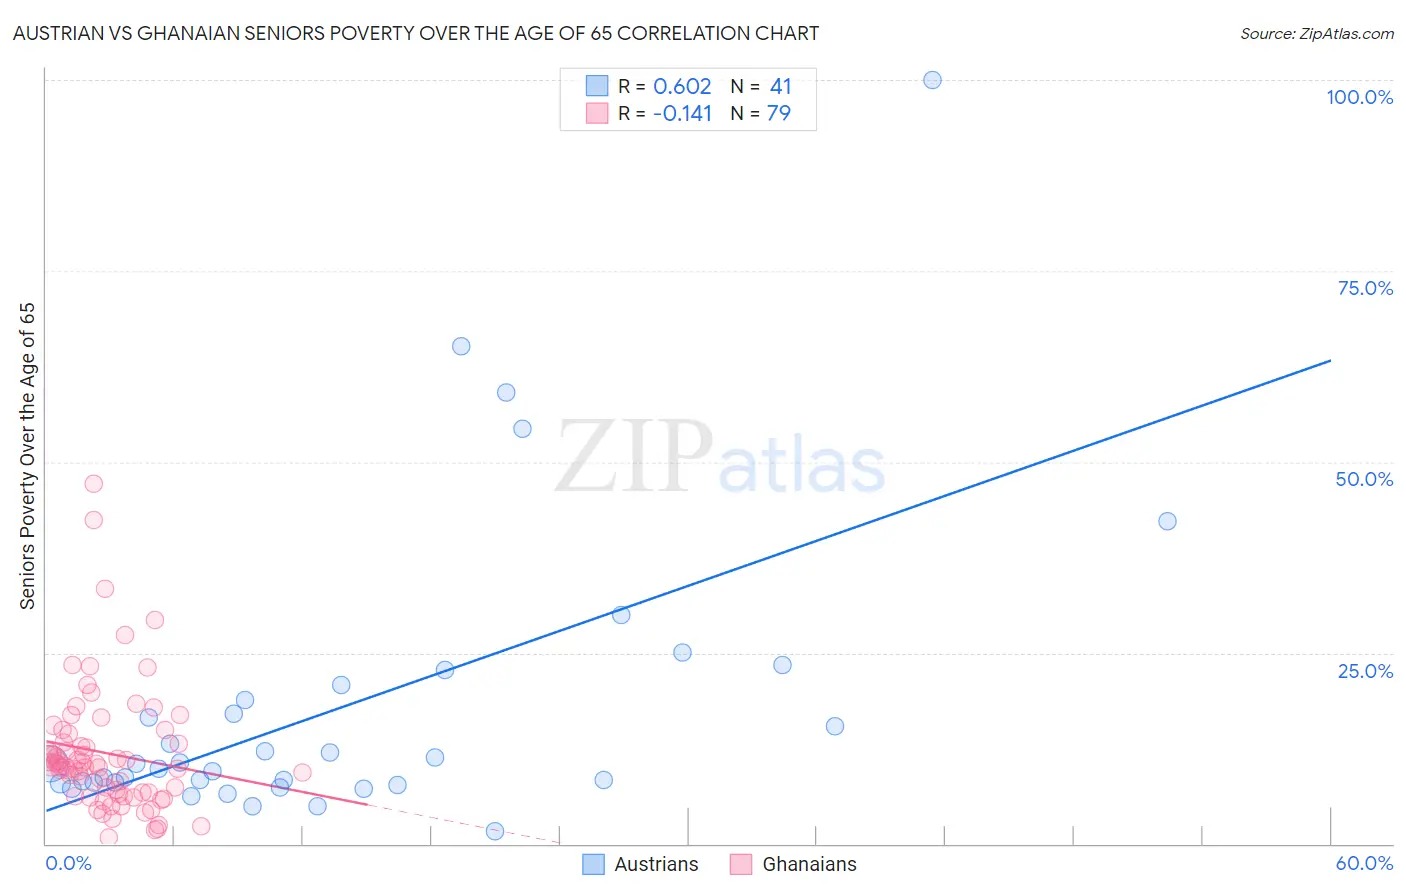
Austrian vs Ghanaian Seniors Poverty Over the Age of 65 Correlation Chart
The statistical analysis conducted on geographies consisting of 450,094,834 people shows a significant positive correlation between the proportion of Austrians and poverty level among seniors over the age of 65 in the United States with a correlation coefficient (R) of 0.602 and weighted average of 9.6%. Similarly, the statistical analysis conducted on geographies consisting of 190,048,350 people shows a poor negative correlation between the proportion of Ghanaians and poverty level among seniors over the age of 65 in the United States with a correlation coefficient (R) of -0.141 and weighted average of 12.4%, a difference of 29.3%.
Seniors Poverty Over the Age of 65 Correlation Summary
| Measurement | Austrian | Ghanaian |
| Minimum | 1.6% | 0.81% |
| Maximum | 100.0% | 47.2% |
| Range | 98.4% | 46.4% |
| Mean | 18.0% | 11.9% |
| Median | 10.5% | 10.1% |
| Interquartile 25% (IQ1) | 7.9% | 6.5% |
| Interquartile 75% (IQ3) | 19.8% | 14.5% |
| Interquartile Range (IQR) | 11.8% | 8.0% |
| Standard Deviation (Sample) | 19.7% | 8.3% |
| Standard Deviation (Population) | 19.4% | 8.2% |
Similar Demographics by Seniors Poverty Over the Age of 65
Demographics Similar to Austrians by Seniors Poverty Over the Age of 65
In terms of seniors poverty over the age of 65, the demographic groups most similar to Austrians are Eastern European (9.6%, a difference of 0.10%), Estonian (9.6%, a difference of 0.18%), Zimbabwean (9.6%, a difference of 0.20%), Immigrants from Taiwan (9.7%, a difference of 0.32%), and Immigrants from South Central Asia (9.7%, a difference of 0.33%).
| Demographics | Rating | Rank | Seniors Poverty Over the Age of 65 |
| Scotch-Irish | 99.7 /100 | #37 | Exceptional 9.5% |
| Belgians | 99.7 /100 | #38 | Exceptional 9.5% |
| Greeks | 99.6 /100 | #39 | Exceptional 9.6% |
| Assyrians/Chaldeans/Syriacs | 99.6 /100 | #40 | Exceptional 9.6% |
| Immigrants | North Macedonia | 99.6 /100 | #41 | Exceptional 9.6% |
| Zimbabweans | 99.6 /100 | #42 | Exceptional 9.6% |
| Eastern Europeans | 99.6 /100 | #43 | Exceptional 9.6% |
| Austrians | 99.5 /100 | #44 | Exceptional 9.6% |
| Estonians | 99.5 /100 | #45 | Exceptional 9.6% |
| Immigrants | Taiwan | 99.5 /100 | #46 | Exceptional 9.7% |
| Immigrants | South Central Asia | 99.5 /100 | #47 | Exceptional 9.7% |
| French | 99.5 /100 | #48 | Exceptional 9.7% |
| Immigrants | Lithuania | 99.4 /100 | #49 | Exceptional 9.7% |
| Hungarians | 99.4 /100 | #50 | Exceptional 9.7% |
| Carpatho Rusyns | 99.3 /100 | #51 | Exceptional 9.7% |
Demographics Similar to Ghanaians by Seniors Poverty Over the Age of 65
In terms of seniors poverty over the age of 65, the demographic groups most similar to Ghanaians are Dutch West Indian (12.4%, a difference of 0.030%), South American (12.5%, a difference of 0.24%), Immigrants from Panama (12.4%, a difference of 0.28%), Immigrants (12.4%, a difference of 0.28%), and Colombian (12.5%, a difference of 0.48%).
| Demographics | Rating | Rank | Seniors Poverty Over the Age of 65 |
| Armenians | 0.3 /100 | #252 | Tragic 12.3% |
| Shoshone | 0.3 /100 | #253 | Tragic 12.3% |
| Immigrants | Cambodia | 0.3 /100 | #254 | Tragic 12.4% |
| Mexican American Indians | 0.3 /100 | #255 | Tragic 12.4% |
| Immigrants | Panama | 0.2 /100 | #256 | Tragic 12.4% |
| Immigrants | Immigrants | 0.2 /100 | #257 | Tragic 12.4% |
| Dutch West Indians | 0.2 /100 | #258 | Tragic 12.4% |
| Ghanaians | 0.2 /100 | #259 | Tragic 12.4% |
| South Americans | 0.2 /100 | #260 | Tragic 12.5% |
| Colombians | 0.2 /100 | #261 | Tragic 12.5% |
| Venezuelans | 0.1 /100 | #262 | Tragic 12.5% |
| Soviet Union | 0.1 /100 | #263 | Tragic 12.6% |
| Inupiat | 0.1 /100 | #264 | Tragic 12.6% |
| Immigrants | Western Africa | 0.1 /100 | #265 | Tragic 12.6% |
| Africans | 0.1 /100 | #266 | Tragic 12.6% |