Czechoslovakian vs Ghanaian Associate's Degree
COMPARE
Czechoslovakian
Ghanaian
Associate's Degree
Associate's Degree Comparison
Czechoslovakians
Ghanaians
46.0%
ASSOCIATE'S DEGREE
40.0/ 100
METRIC RATING
184th/ 347
METRIC RANK
45.8%
ASSOCIATE'S DEGREE
35.5/ 100
METRIC RATING
188th/ 347
METRIC RANK
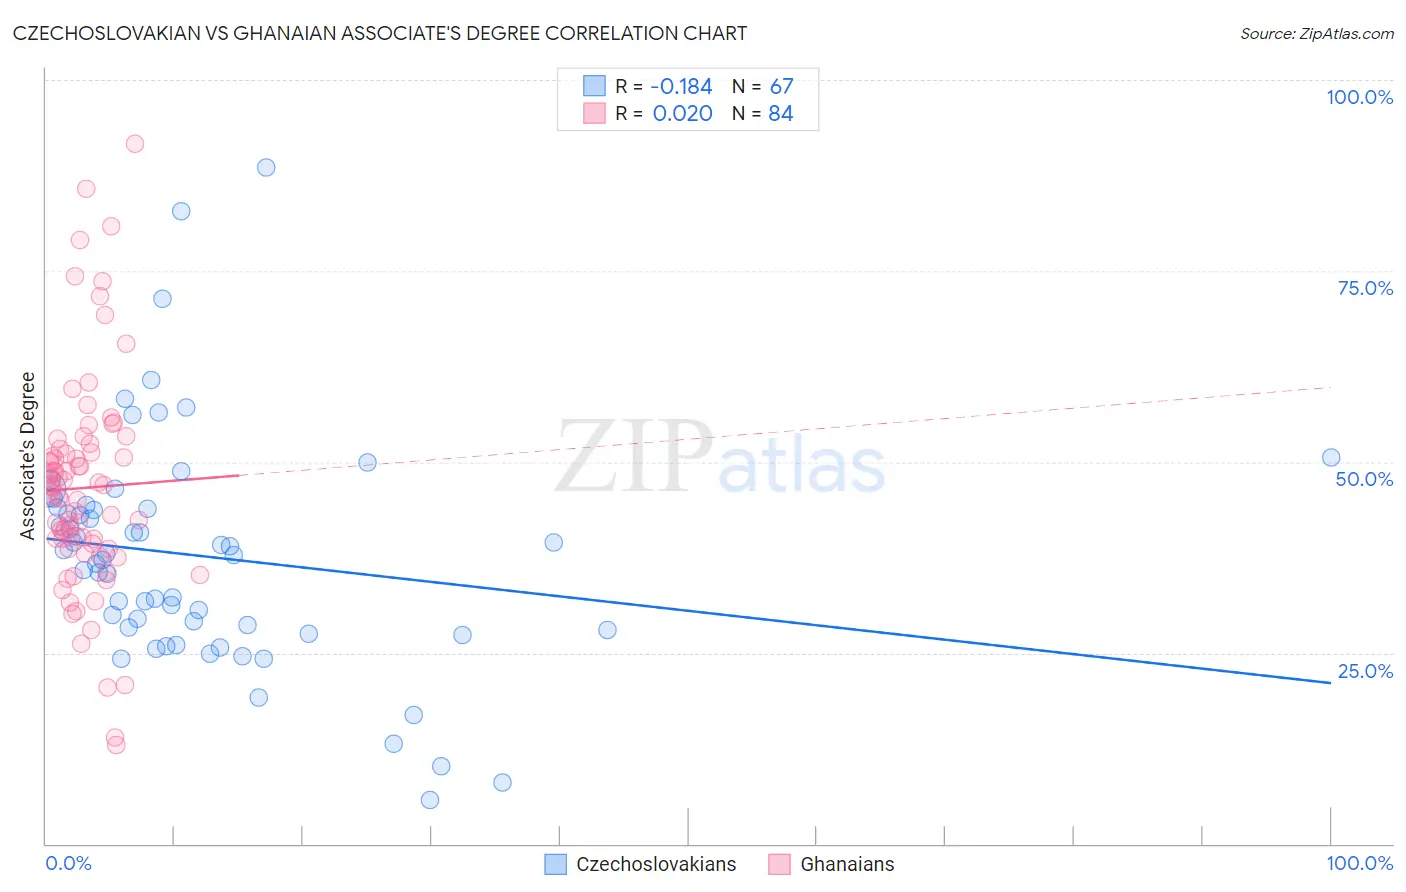
Czechoslovakian vs Ghanaian Associate's Degree Correlation Chart
The statistical analysis conducted on geographies consisting of 368,660,591 people shows a poor negative correlation between the proportion of Czechoslovakians and percentage of population with at least associate's degree education in the United States with a correlation coefficient (R) of -0.184 and weighted average of 46.0%. Similarly, the statistical analysis conducted on geographies consisting of 190,686,281 people shows no correlation between the proportion of Ghanaians and percentage of population with at least associate's degree education in the United States with a correlation coefficient (R) of 0.020 and weighted average of 45.8%, a difference of 0.37%.
Associate's Degree Correlation Summary
| Measurement | Czechoslovakian | Ghanaian |
| Minimum | 5.7% | 13.0% |
| Maximum | 88.6% | 91.7% |
| Range | 82.8% | 78.7% |
| Mean | 37.6% | 46.6% |
| Median | 37.8% | 46.4% |
| Interquartile 25% (IQ1) | 28.0% | 38.9% |
| Interquartile 75% (IQ3) | 44.1% | 51.4% |
| Interquartile Range (IQR) | 16.1% | 12.5% |
| Standard Deviation (Sample) | 15.1% | 14.3% |
| Standard Deviation (Population) | 15.0% | 14.2% |
Demographics Similar to Czechoslovakians and Ghanaians by Associate's Degree
In terms of associate's degree, the demographic groups most similar to Czechoslovakians are Yugoslavian (46.0%, a difference of 0.020%), Swiss (46.0%, a difference of 0.030%), Immigrants from Colombia (46.0%, a difference of 0.10%), Costa Rican (46.0%, a difference of 0.11%), and Welsh (45.9%, a difference of 0.17%). Similarly, the demographic groups most similar to Ghanaians are Immigrants from Uruguay (45.8%, a difference of 0.0%), Immigrants from Oceania (45.8%, a difference of 0.060%), Vietnamese (45.8%, a difference of 0.12%), Korean (45.8%, a difference of 0.13%), and Celtic (45.8%, a difference of 0.18%).
| Demographics | Rating | Rank | Associate's Degree |
| Finns | 48.5 /100 | #176 | Average 46.3% |
| Slovaks | 48.4 /100 | #177 | Average 46.3% |
| Immigrants | Bosnia and Herzegovina | 48.3 /100 | #178 | Average 46.3% |
| Sri Lankans | 47.6 /100 | #179 | Average 46.3% |
| Bermudans | 46.4 /100 | #180 | Average 46.2% |
| Immigrants | Colombia | 41.3 /100 | #181 | Average 46.0% |
| Swiss | 40.4 /100 | #182 | Average 46.0% |
| Yugoslavians | 40.2 /100 | #183 | Average 46.0% |
| Czechoslovakians | 40.0 /100 | #184 | Average 46.0% |
| Costa Ricans | 38.6 /100 | #185 | Fair 46.0% |
| Welsh | 37.9 /100 | #186 | Fair 45.9% |
| Immigrants | Uruguay | 35.5 /100 | #187 | Fair 45.8% |
| Ghanaians | 35.5 /100 | #188 | Fair 45.8% |
| Immigrants | Oceania | 34.7 /100 | #189 | Fair 45.8% |
| Vietnamese | 34.0 /100 | #190 | Fair 45.8% |
| Koreans | 33.8 /100 | #191 | Fair 45.8% |
| Celtics | 33.3 /100 | #192 | Fair 45.8% |
| Immigrants | Cameroon | 31.0 /100 | #193 | Fair 45.7% |
| Immigrants | Peru | 27.6 /100 | #194 | Fair 45.5% |
| Germans | 26.5 /100 | #195 | Fair 45.5% |
| French | 25.6 /100 | #196 | Fair 45.4% |