Taiwanese vs Ghanaian Associate's Degree
COMPARE
Taiwanese
Ghanaian
Associate's Degree
Associate's Degree Comparison
Taiwanese
Ghanaians
47.7%
ASSOCIATE'S DEGREE
83.3/ 100
METRIC RATING
141st/ 347
METRIC RANK
45.8%
ASSOCIATE'S DEGREE
35.5/ 100
METRIC RATING
188th/ 347
METRIC RANK
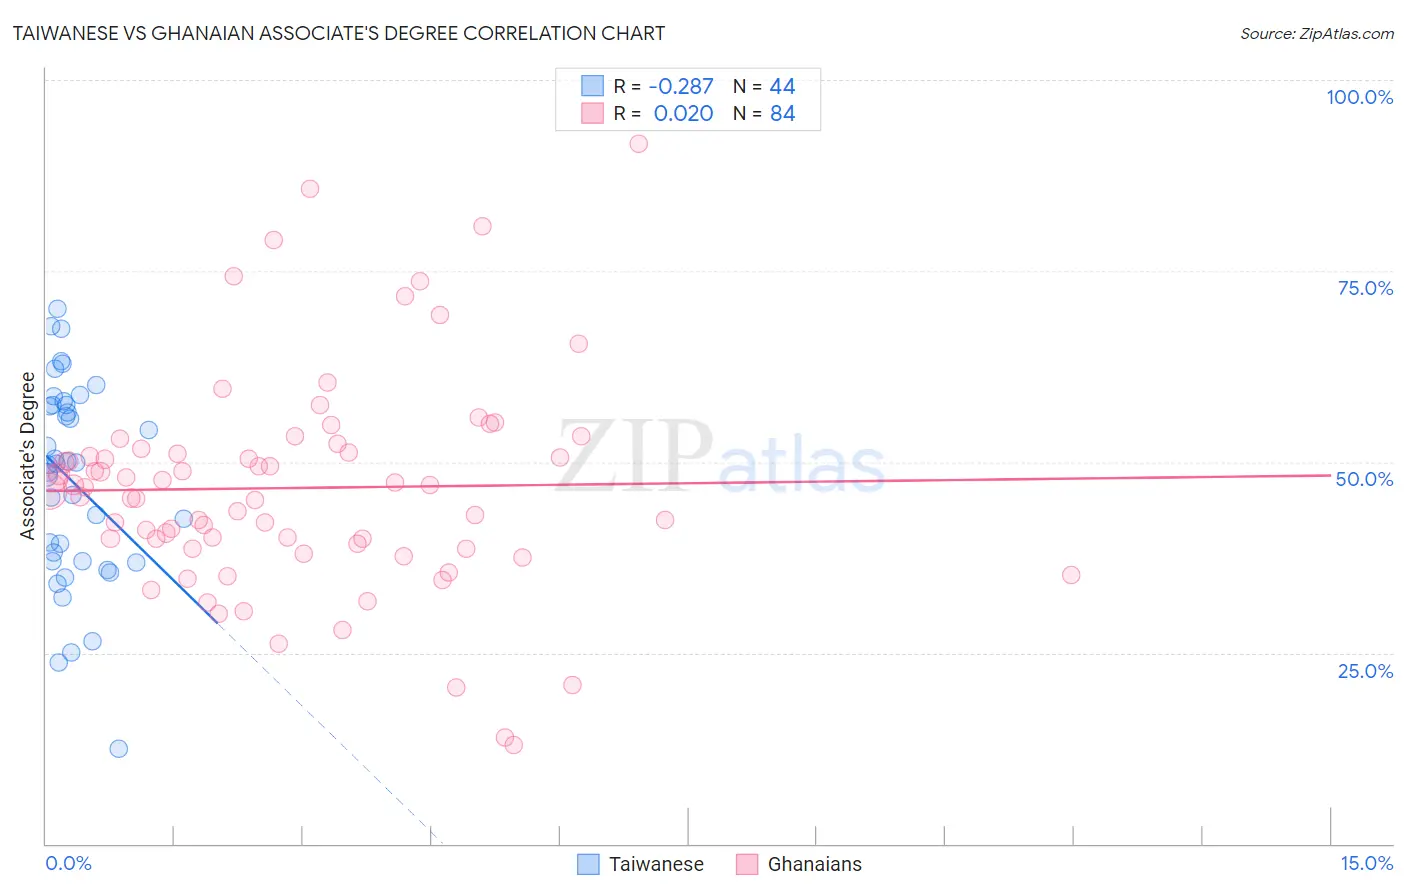
Taiwanese vs Ghanaian Associate's Degree Correlation Chart
The statistical analysis conducted on geographies consisting of 31,724,936 people shows a weak negative correlation between the proportion of Taiwanese and percentage of population with at least associate's degree education in the United States with a correlation coefficient (R) of -0.287 and weighted average of 47.7%. Similarly, the statistical analysis conducted on geographies consisting of 190,686,281 people shows no correlation between the proportion of Ghanaians and percentage of population with at least associate's degree education in the United States with a correlation coefficient (R) of 0.020 and weighted average of 45.8%, a difference of 4.2%.
Associate's Degree Correlation Summary
| Measurement | Taiwanese | Ghanaian |
| Minimum | 12.5% | 13.0% |
| Maximum | 70.0% | 91.7% |
| Range | 57.5% | 78.7% |
| Mean | 47.4% | 46.6% |
| Median | 49.7% | 46.4% |
| Interquartile 25% (IQ1) | 36.9% | 38.9% |
| Interquartile 75% (IQ3) | 57.5% | 51.4% |
| Interquartile Range (IQR) | 20.5% | 12.5% |
| Standard Deviation (Sample) | 13.1% | 14.3% |
| Standard Deviation (Population) | 12.9% | 14.2% |
Similar Demographics by Associate's Degree
Demographics Similar to Taiwanese by Associate's Degree
In terms of associate's degree, the demographic groups most similar to Taiwanese are Sierra Leonean (47.7%, a difference of 0.050%), Immigrants from Southern Europe (47.8%, a difference of 0.15%), Slovene (47.9%, a difference of 0.24%), Norwegian (47.6%, a difference of 0.28%), and Slavic (47.6%, a difference of 0.34%).
| Demographics | Rating | Rank | Associate's Degree |
| Moroccans | 89.3 /100 | #134 | Excellent 48.2% |
| Europeans | 89.0 /100 | #135 | Excellent 48.2% |
| Pakistanis | 88.0 /100 | #136 | Excellent 48.1% |
| Immigrants | Eritrea | 87.8 /100 | #137 | Excellent 48.1% |
| Poles | 87.3 /100 | #138 | Excellent 48.0% |
| Slovenes | 85.1 /100 | #139 | Excellent 47.9% |
| Immigrants | Southern Europe | 84.4 /100 | #140 | Excellent 47.8% |
| Taiwanese | 83.3 /100 | #141 | Excellent 47.7% |
| Sierra Leoneans | 82.9 /100 | #142 | Excellent 47.7% |
| Norwegians | 81.0 /100 | #143 | Excellent 47.6% |
| Slavs | 80.5 /100 | #144 | Excellent 47.6% |
| Canadians | 79.0 /100 | #145 | Good 47.5% |
| Immigrants | Sudan | 77.9 /100 | #146 | Good 47.4% |
| Danes | 77.3 /100 | #147 | Good 47.4% |
| South American Indians | 76.7 /100 | #148 | Good 47.4% |
Demographics Similar to Ghanaians by Associate's Degree
In terms of associate's degree, the demographic groups most similar to Ghanaians are Immigrants from Uruguay (45.8%, a difference of 0.0%), Immigrants from Oceania (45.8%, a difference of 0.060%), Vietnamese (45.8%, a difference of 0.12%), Korean (45.8%, a difference of 0.13%), and Celtic (45.8%, a difference of 0.18%).
| Demographics | Rating | Rank | Associate's Degree |
| Immigrants | Colombia | 41.3 /100 | #181 | Average 46.0% |
| Swiss | 40.4 /100 | #182 | Average 46.0% |
| Yugoslavians | 40.2 /100 | #183 | Average 46.0% |
| Czechoslovakians | 40.0 /100 | #184 | Average 46.0% |
| Costa Ricans | 38.6 /100 | #185 | Fair 46.0% |
| Welsh | 37.9 /100 | #186 | Fair 45.9% |
| Immigrants | Uruguay | 35.5 /100 | #187 | Fair 45.8% |
| Ghanaians | 35.5 /100 | #188 | Fair 45.8% |
| Immigrants | Oceania | 34.7 /100 | #189 | Fair 45.8% |
| Vietnamese | 34.0 /100 | #190 | Fair 45.8% |
| Koreans | 33.8 /100 | #191 | Fair 45.8% |
| Celtics | 33.3 /100 | #192 | Fair 45.8% |
| Immigrants | Cameroon | 31.0 /100 | #193 | Fair 45.7% |
| Immigrants | Peru | 27.6 /100 | #194 | Fair 45.5% |
| Germans | 26.5 /100 | #195 | Fair 45.5% |