Australian vs Swiss No Schooling Completed
COMPARE
Australian
Swiss
No Schooling Completed
No Schooling Completed Comparison
Australians
Swiss
1.6%
NO SCHOOLING COMPLETED
99.9/ 100
METRIC RATING
43rd/ 347
METRIC RANK
1.5%
NO SCHOOLING COMPLETED
100.0/ 100
METRIC RATING
32nd/ 347
METRIC RANK
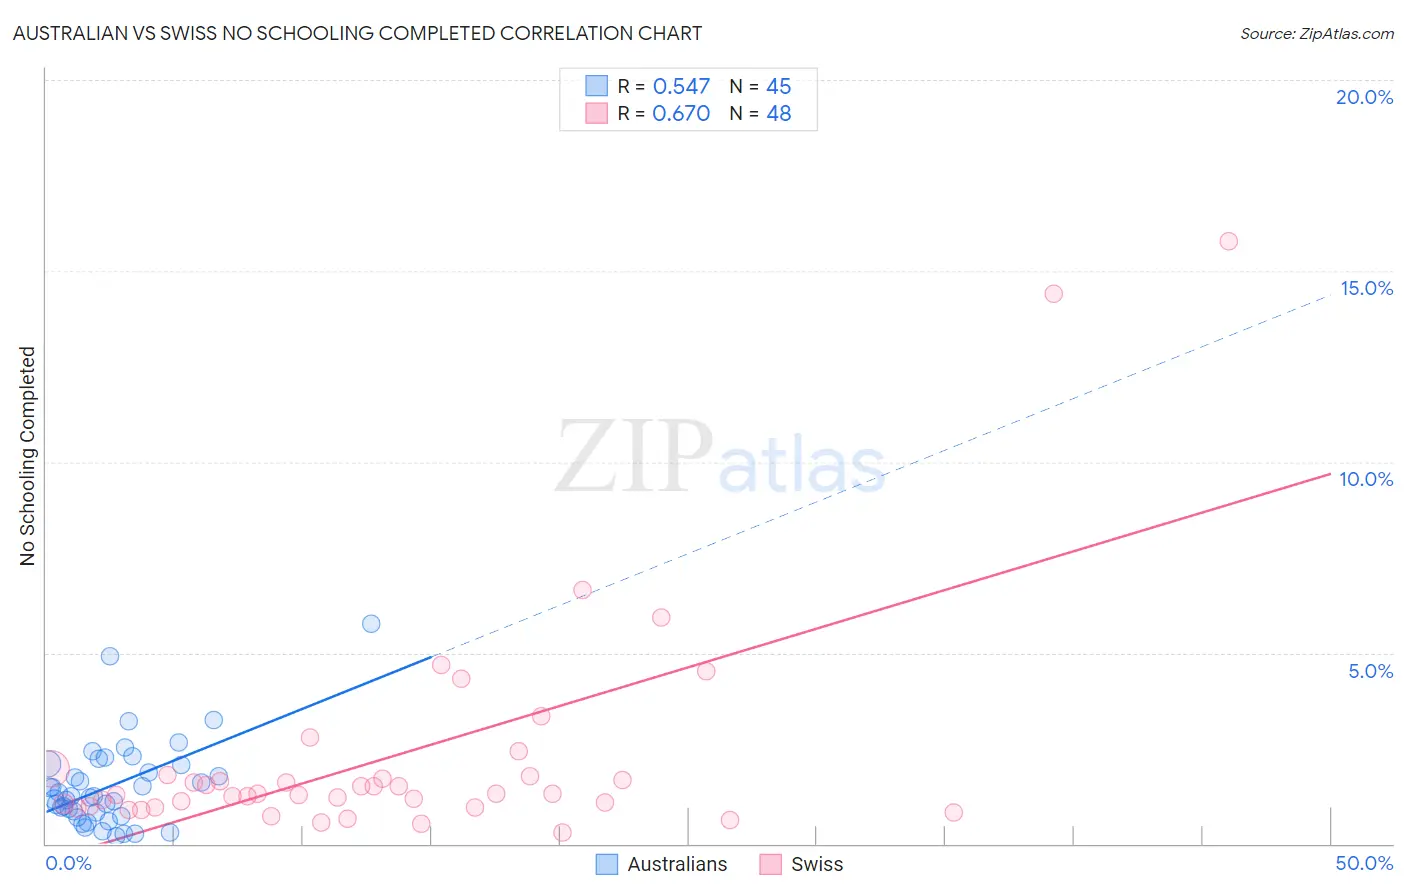
Australian vs Swiss No Schooling Completed Correlation Chart
The statistical analysis conducted on geographies consisting of 222,453,601 people shows a substantial positive correlation between the proportion of Australians and percentage of population with no schooling in the United States with a correlation coefficient (R) of 0.547 and weighted average of 1.6%. Similarly, the statistical analysis conducted on geographies consisting of 455,291,102 people shows a significant positive correlation between the proportion of Swiss and percentage of population with no schooling in the United States with a correlation coefficient (R) of 0.670 and weighted average of 1.5%, a difference of 5.9%.
No Schooling Completed Correlation Summary
| Measurement | Australian | Swiss |
| Minimum | 0.20% | 0.31% |
| Maximum | 5.8% | 15.8% |
| Range | 5.6% | 15.5% |
| Mean | 1.5% | 2.3% |
| Median | 1.2% | 1.3% |
| Interquartile 25% (IQ1) | 0.77% | 0.97% |
| Interquartile 75% (IQ3) | 2.1% | 1.8% |
| Interquartile Range (IQR) | 1.3% | 0.82% |
| Standard Deviation (Sample) | 1.1% | 3.0% |
| Standard Deviation (Population) | 1.1% | 3.0% |
Demographics Similar to Australians and Swiss by No Schooling Completed
In terms of no schooling completed, the demographic groups most similar to Australians are Bulgarian (1.6%, a difference of 0.12%), Estonian (1.6%, a difference of 0.19%), Czechoslovakian (1.6%, a difference of 0.23%), Maltese (1.6%, a difference of 0.32%), and Ottawa (1.6%, a difference of 0.47%). Similarly, the demographic groups most similar to Swiss are Inupiat (1.5%, a difference of 0.39%), British (1.5%, a difference of 0.42%), Italian (1.5%, a difference of 0.68%), Lumbee (1.5%, a difference of 0.91%), and Latvian (1.5%, a difference of 0.94%).
| Demographics | Rating | Rank | No Schooling Completed |
| Scandinavians | 100.0 /100 | #27 | Exceptional 1.5% |
| French Canadians | 100.0 /100 | #28 | Exceptional 1.5% |
| Lumbee | 100.0 /100 | #29 | Exceptional 1.5% |
| British | 100.0 /100 | #30 | Exceptional 1.5% |
| Inupiat | 100.0 /100 | #31 | Exceptional 1.5% |
| Swiss | 100.0 /100 | #32 | Exceptional 1.5% |
| Italians | 100.0 /100 | #33 | Exceptional 1.5% |
| Latvians | 100.0 /100 | #34 | Exceptional 1.5% |
| Eastern Europeans | 100.0 /100 | #35 | Exceptional 1.6% |
| Aleuts | 99.9 /100 | #36 | Exceptional 1.6% |
| Belgians | 99.9 /100 | #37 | Exceptional 1.6% |
| Northern Europeans | 99.9 /100 | #38 | Exceptional 1.6% |
| Native Hawaiians | 99.9 /100 | #39 | Exceptional 1.6% |
| Luxembourgers | 99.9 /100 | #40 | Exceptional 1.6% |
| Hungarians | 99.9 /100 | #41 | Exceptional 1.6% |
| Bulgarians | 99.9 /100 | #42 | Exceptional 1.6% |
| Australians | 99.9 /100 | #43 | Exceptional 1.6% |
| Estonians | 99.9 /100 | #44 | Exceptional 1.6% |
| Czechoslovakians | 99.9 /100 | #45 | Exceptional 1.6% |
| Maltese | 99.9 /100 | #46 | Exceptional 1.6% |
| Ottawa | 99.9 /100 | #47 | Exceptional 1.6% |