Australian vs Immigrants from Bulgaria No Schooling Completed
COMPARE
Australian
Immigrants from Bulgaria
No Schooling Completed
No Schooling Completed Comparison
Australians
Immigrants from Bulgaria
1.6%
NO SCHOOLING COMPLETED
99.9/ 100
METRIC RATING
43rd/ 347
METRIC RANK
1.9%
NO SCHOOLING COMPLETED
94.6/ 100
METRIC RATING
120th/ 347
METRIC RANK
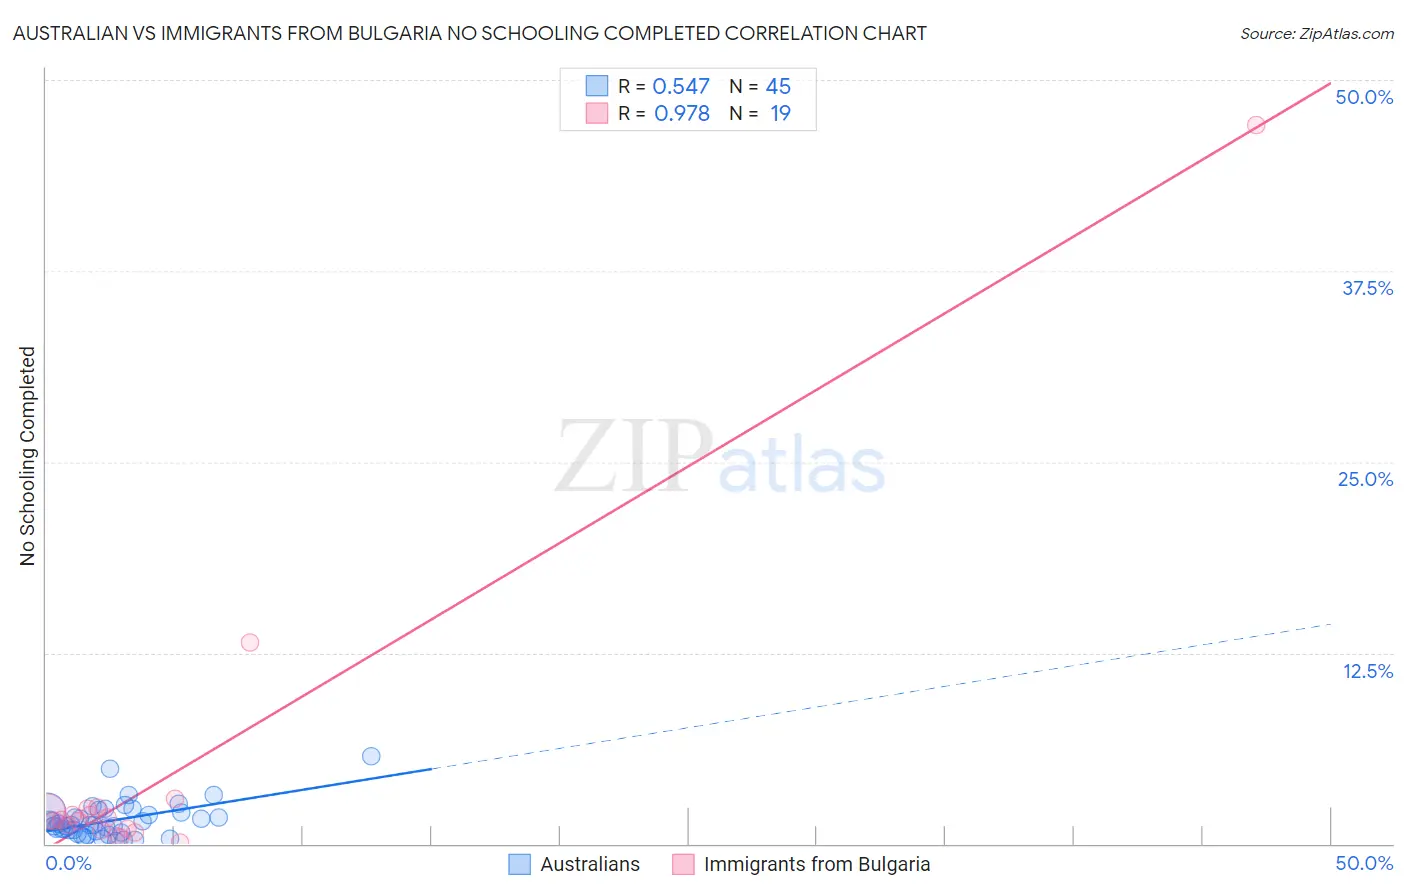
Australian vs Immigrants from Bulgaria No Schooling Completed Correlation Chart
The statistical analysis conducted on geographies consisting of 222,453,601 people shows a substantial positive correlation between the proportion of Australians and percentage of population with no schooling in the United States with a correlation coefficient (R) of 0.547 and weighted average of 1.6%. Similarly, the statistical analysis conducted on geographies consisting of 171,926,286 people shows a perfect positive correlation between the proportion of Immigrants from Bulgaria and percentage of population with no schooling in the United States with a correlation coefficient (R) of 0.978 and weighted average of 1.9%, a difference of 16.9%.
No Schooling Completed Correlation Summary
| Measurement | Australian | Immigrants from Bulgaria |
| Minimum | 0.20% | 0.085% |
| Maximum | 5.8% | 47.1% |
| Range | 5.6% | 47.0% |
| Mean | 1.5% | 4.5% |
| Median | 1.2% | 1.5% |
| Interquartile 25% (IQ1) | 0.77% | 0.90% |
| Interquartile 75% (IQ3) | 2.1% | 2.3% |
| Interquartile Range (IQR) | 1.3% | 1.4% |
| Standard Deviation (Sample) | 1.1% | 10.7% |
| Standard Deviation (Population) | 1.1% | 10.4% |
Similar Demographics by No Schooling Completed
Demographics Similar to Australians by No Schooling Completed
In terms of no schooling completed, the demographic groups most similar to Australians are Bulgarian (1.6%, a difference of 0.12%), Estonian (1.6%, a difference of 0.19%), Czechoslovakian (1.6%, a difference of 0.23%), Maltese (1.6%, a difference of 0.32%), and Ottawa (1.6%, a difference of 0.47%).
| Demographics | Rating | Rank | No Schooling Completed |
| Aleuts | 99.9 /100 | #36 | Exceptional 1.6% |
| Belgians | 99.9 /100 | #37 | Exceptional 1.6% |
| Northern Europeans | 99.9 /100 | #38 | Exceptional 1.6% |
| Native Hawaiians | 99.9 /100 | #39 | Exceptional 1.6% |
| Luxembourgers | 99.9 /100 | #40 | Exceptional 1.6% |
| Hungarians | 99.9 /100 | #41 | Exceptional 1.6% |
| Bulgarians | 99.9 /100 | #42 | Exceptional 1.6% |
| Australians | 99.9 /100 | #43 | Exceptional 1.6% |
| Estonians | 99.9 /100 | #44 | Exceptional 1.6% |
| Czechoslovakians | 99.9 /100 | #45 | Exceptional 1.6% |
| Maltese | 99.9 /100 | #46 | Exceptional 1.6% |
| Ottawa | 99.9 /100 | #47 | Exceptional 1.6% |
| Immigrants | Scotland | 99.9 /100 | #48 | Exceptional 1.6% |
| Whites/Caucasians | 99.9 /100 | #49 | Exceptional 1.6% |
| Celtics | 99.9 /100 | #50 | Exceptional 1.6% |
Demographics Similar to Immigrants from Bulgaria by No Schooling Completed
In terms of no schooling completed, the demographic groups most similar to Immigrants from Bulgaria are Immigrants from Croatia (1.9%, a difference of 0.060%), Cree (1.9%, a difference of 0.090%), Iroquois (1.9%, a difference of 0.40%), Immigrants from Kuwait (1.9%, a difference of 0.46%), and Cambodian (1.9%, a difference of 0.53%).
| Demographics | Rating | Rank | No Schooling Completed |
| Immigrants | Zimbabwe | 96.2 /100 | #113 | Exceptional 1.9% |
| Immigrants | Norway | 96.1 /100 | #114 | Exceptional 1.9% |
| Syrians | 96.0 /100 | #115 | Exceptional 1.9% |
| Lebanese | 96.0 /100 | #116 | Exceptional 1.9% |
| Immigrants | Serbia | 95.8 /100 | #117 | Exceptional 1.9% |
| Spanish | 95.5 /100 | #118 | Exceptional 1.9% |
| Iroquois | 95.1 /100 | #119 | Exceptional 1.9% |
| Immigrants | Bulgaria | 94.6 /100 | #120 | Exceptional 1.9% |
| Immigrants | Croatia | 94.5 /100 | #121 | Exceptional 1.9% |
| Cree | 94.5 /100 | #122 | Exceptional 1.9% |
| Immigrants | Kuwait | 93.9 /100 | #123 | Exceptional 1.9% |
| Cambodians | 93.8 /100 | #124 | Exceptional 1.9% |
| Immigrants | Europe | 93.7 /100 | #125 | Exceptional 1.9% |
| Immigrants | Romania | 92.6 /100 | #126 | Exceptional 1.9% |
| Israelis | 92.4 /100 | #127 | Exceptional 1.9% |