Australian vs Immigrants from Egypt No Schooling Completed
COMPARE
Australian
Immigrants from Egypt
No Schooling Completed
No Schooling Completed Comparison
Australians
Immigrants from Egypt
1.6%
NO SCHOOLING COMPLETED
99.9/ 100
METRIC RATING
43rd/ 347
METRIC RANK
2.1%
NO SCHOOLING COMPLETED
36.1/ 100
METRIC RATING
189th/ 347
METRIC RANK
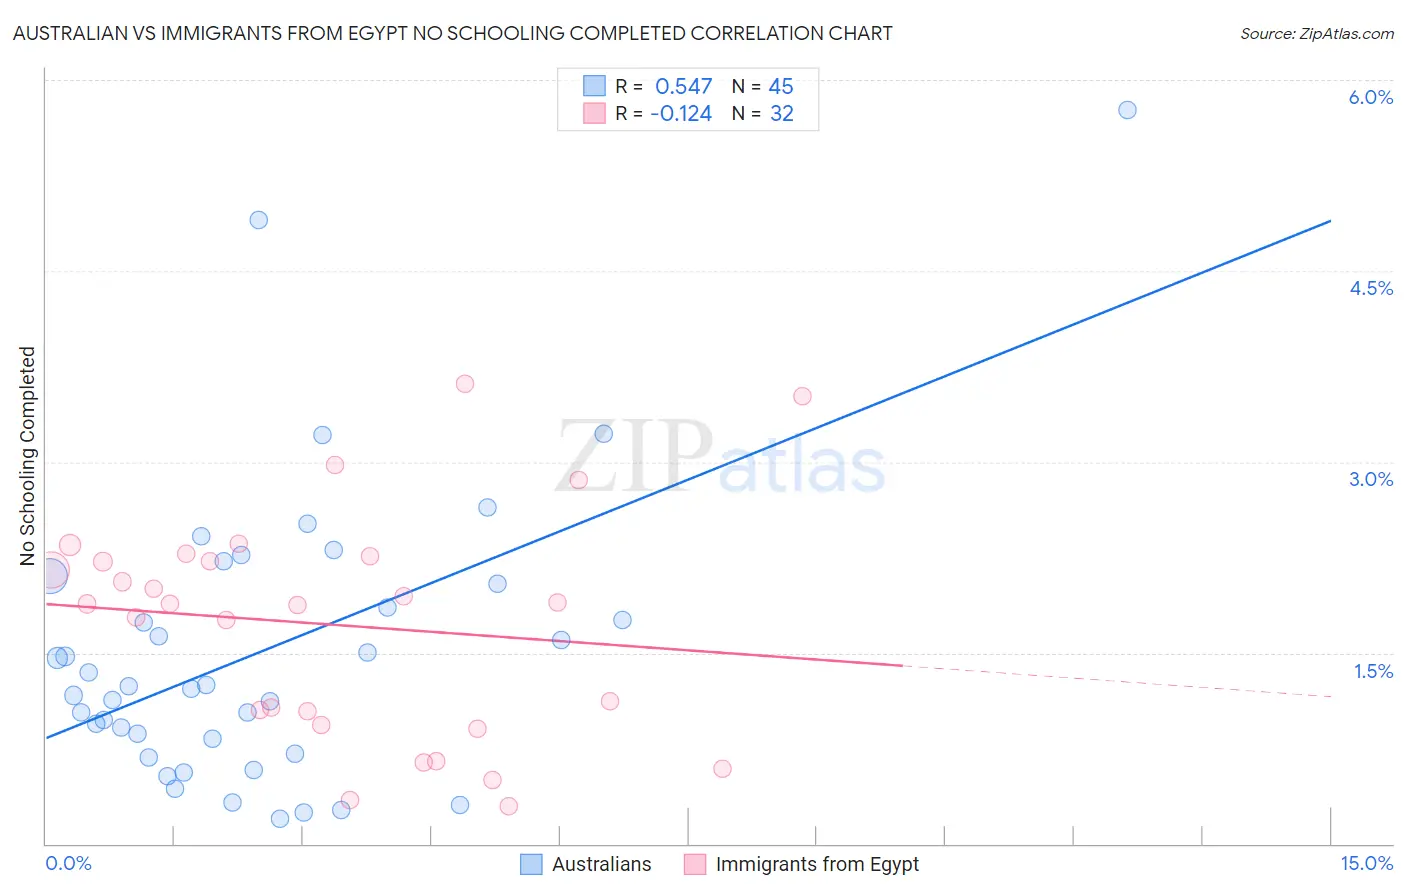
Australian vs Immigrants from Egypt No Schooling Completed Correlation Chart
The statistical analysis conducted on geographies consisting of 222,453,601 people shows a substantial positive correlation between the proportion of Australians and percentage of population with no schooling in the United States with a correlation coefficient (R) of 0.547 and weighted average of 1.6%. Similarly, the statistical analysis conducted on geographies consisting of 244,482,596 people shows a poor negative correlation between the proportion of Immigrants from Egypt and percentage of population with no schooling in the United States with a correlation coefficient (R) of -0.124 and weighted average of 2.1%, a difference of 31.8%.
No Schooling Completed Correlation Summary
| Measurement | Australian | Immigrants from Egypt |
| Minimum | 0.20% | 0.29% |
| Maximum | 5.8% | 3.6% |
| Range | 5.6% | 3.3% |
| Mean | 1.5% | 1.7% |
| Median | 1.2% | 1.9% |
| Interquartile 25% (IQ1) | 0.77% | 0.98% |
| Interquartile 75% (IQ3) | 2.1% | 2.2% |
| Interquartile Range (IQR) | 1.3% | 1.3% |
| Standard Deviation (Sample) | 1.1% | 0.88% |
| Standard Deviation (Population) | 1.1% | 0.87% |
Similar Demographics by No Schooling Completed
Demographics Similar to Australians by No Schooling Completed
In terms of no schooling completed, the demographic groups most similar to Australians are Bulgarian (1.6%, a difference of 0.12%), Estonian (1.6%, a difference of 0.19%), Czechoslovakian (1.6%, a difference of 0.23%), Maltese (1.6%, a difference of 0.32%), and Ottawa (1.6%, a difference of 0.47%).
| Demographics | Rating | Rank | No Schooling Completed |
| Aleuts | 99.9 /100 | #36 | Exceptional 1.6% |
| Belgians | 99.9 /100 | #37 | Exceptional 1.6% |
| Northern Europeans | 99.9 /100 | #38 | Exceptional 1.6% |
| Native Hawaiians | 99.9 /100 | #39 | Exceptional 1.6% |
| Luxembourgers | 99.9 /100 | #40 | Exceptional 1.6% |
| Hungarians | 99.9 /100 | #41 | Exceptional 1.6% |
| Bulgarians | 99.9 /100 | #42 | Exceptional 1.6% |
| Australians | 99.9 /100 | #43 | Exceptional 1.6% |
| Estonians | 99.9 /100 | #44 | Exceptional 1.6% |
| Czechoslovakians | 99.9 /100 | #45 | Exceptional 1.6% |
| Maltese | 99.9 /100 | #46 | Exceptional 1.6% |
| Ottawa | 99.9 /100 | #47 | Exceptional 1.6% |
| Immigrants | Scotland | 99.9 /100 | #48 | Exceptional 1.6% |
| Whites/Caucasians | 99.9 /100 | #49 | Exceptional 1.6% |
| Celtics | 99.9 /100 | #50 | Exceptional 1.6% |
Demographics Similar to Immigrants from Egypt by No Schooling Completed
In terms of no schooling completed, the demographic groups most similar to Immigrants from Egypt are Immigrants from Kenya (2.1%, a difference of 0.010%), Navajo (2.1%, a difference of 0.060%), Immigrants from Bosnia and Herzegovina (2.1%, a difference of 0.36%), Spanish American (2.1%, a difference of 0.51%), and Mongolian (2.1%, a difference of 0.66%).
| Demographics | Rating | Rank | No Schooling Completed |
| French American Indians | 42.2 /100 | #182 | Average 2.1% |
| Blacks/African Americans | 41.4 /100 | #183 | Average 2.1% |
| Pima | 41.3 /100 | #184 | Average 2.1% |
| Mongolians | 40.8 /100 | #185 | Average 2.1% |
| Immigrants | Bosnia and Herzegovina | 38.6 /100 | #186 | Fair 2.1% |
| Navajo | 36.5 /100 | #187 | Fair 2.1% |
| Immigrants | Kenya | 36.2 /100 | #188 | Fair 2.1% |
| Immigrants | Egypt | 36.1 /100 | #189 | Fair 2.1% |
| Spanish Americans | 32.6 /100 | #190 | Fair 2.1% |
| Bermudans | 30.7 /100 | #191 | Fair 2.1% |
| Guamanians/Chamorros | 29.8 /100 | #192 | Fair 2.2% |
| Paraguayans | 29.3 /100 | #193 | Fair 2.2% |
| Immigrants | Albania | 28.3 /100 | #194 | Fair 2.2% |
| Hawaiians | 27.0 /100 | #195 | Fair 2.2% |
| Immigrants | Ukraine | 26.1 /100 | #196 | Fair 2.2% |