Assyrian/Chaldean/Syriac vs Croatian High School Diploma
COMPARE
Assyrian/Chaldean/Syriac
Croatian
High School Diploma
High School Diploma Comparison
Assyrians/Chaldeans/Syriacs
Croatians
89.7%
HIGH SCHOOL DIPLOMA
82.5/ 100
METRIC RATING
138th/ 347
METRIC RANK
92.0%
HIGH SCHOOL DIPLOMA
100.0/ 100
METRIC RATING
10th/ 347
METRIC RANK
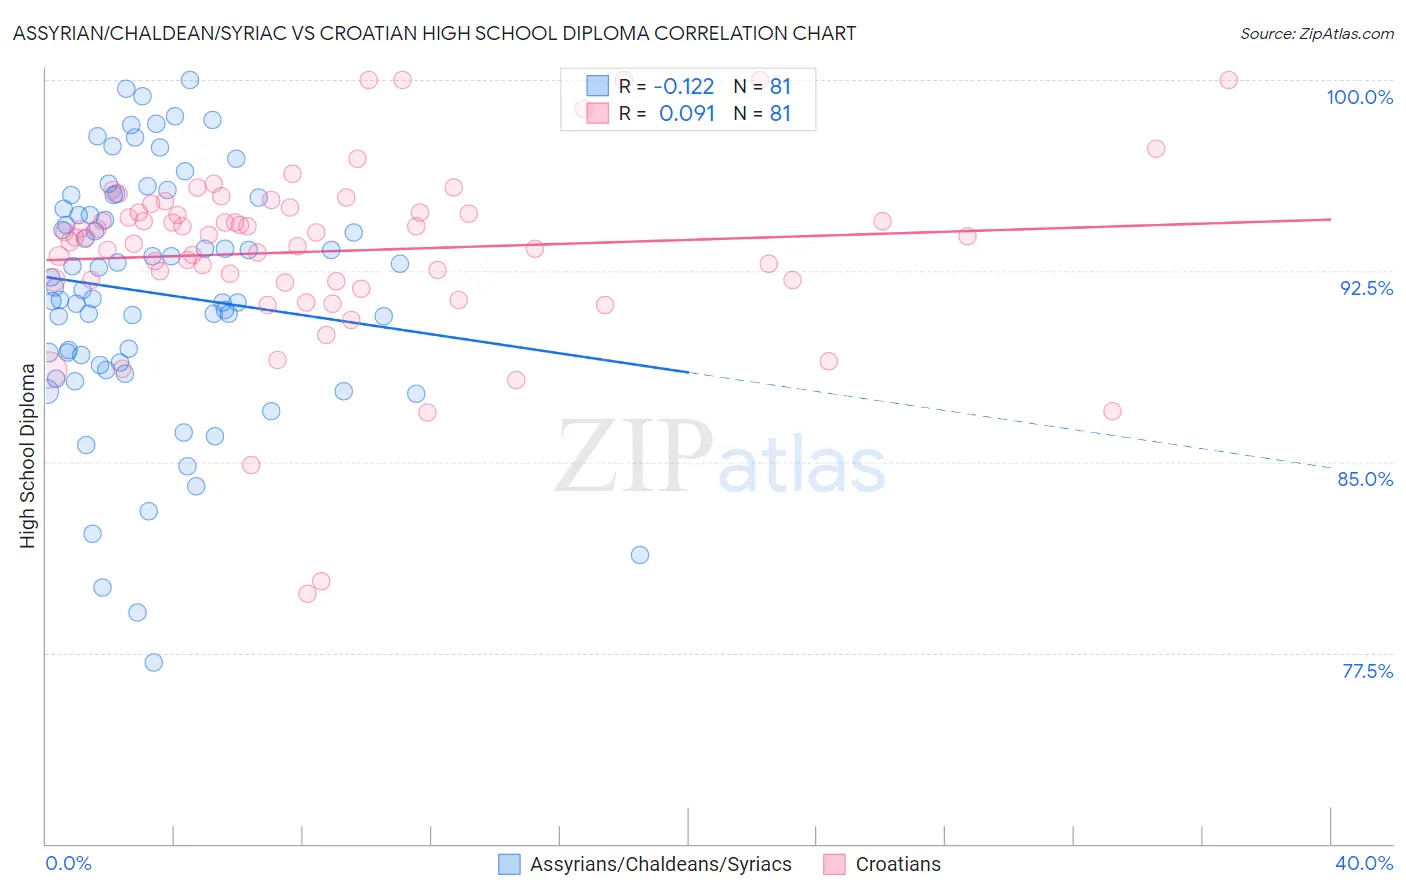
Assyrian/Chaldean/Syriac vs Croatian High School Diploma Correlation Chart
The statistical analysis conducted on geographies consisting of 110,318,304 people shows a poor negative correlation between the proportion of Assyrians/Chaldeans/Syriacs and percentage of population with at least high school diploma education in the United States with a correlation coefficient (R) of -0.122 and weighted average of 89.7%. Similarly, the statistical analysis conducted on geographies consisting of 375,733,787 people shows a slight positive correlation between the proportion of Croatians and percentage of population with at least high school diploma education in the United States with a correlation coefficient (R) of 0.091 and weighted average of 92.0%, a difference of 2.6%.
High School Diploma Correlation Summary
| Measurement | Assyrian/Chaldean/Syriac | Croatian |
| Minimum | 77.1% | 79.8% |
| Maximum | 100.0% | 100.0% |
| Range | 22.9% | 20.2% |
| Mean | 91.6% | 93.3% |
| Median | 91.9% | 93.9% |
| Interquartile 25% (IQ1) | 88.8% | 92.1% |
| Interquartile 75% (IQ3) | 95.2% | 94.9% |
| Interquartile Range (IQR) | 6.3% | 2.8% |
| Standard Deviation (Sample) | 4.9% | 3.6% |
| Standard Deviation (Population) | 4.8% | 3.6% |
Similar Demographics by High School Diploma
Demographics Similar to Assyrians/Chaldeans/Syriacs by High School Diploma
In terms of high school diploma, the demographic groups most similar to Assyrians/Chaldeans/Syriacs are Ugandan (89.7%, a difference of 0.030%), Arab (89.7%, a difference of 0.030%), Kenyan (89.6%, a difference of 0.030%), Immigrants from Egypt (89.6%, a difference of 0.030%), and Chilean (89.6%, a difference of 0.080%).
| Demographics | Rating | Rank | High School Diploma |
| Immigrants | Italy | 87.4 /100 | #131 | Excellent 89.8% |
| Immigrants | Bosnia and Herzegovina | 87.3 /100 | #132 | Excellent 89.8% |
| Albanians | 87.2 /100 | #133 | Excellent 89.8% |
| Immigrants | Jordan | 87.2 /100 | #134 | Excellent 89.8% |
| Chippewa | 85.6 /100 | #135 | Excellent 89.7% |
| Ugandans | 83.7 /100 | #136 | Excellent 89.7% |
| Arabs | 83.6 /100 | #137 | Excellent 89.7% |
| Assyrians/Chaldeans/Syriacs | 82.5 /100 | #138 | Excellent 89.7% |
| Kenyans | 81.4 /100 | #139 | Excellent 89.6% |
| Immigrants | Egypt | 81.2 /100 | #140 | Excellent 89.6% |
| Chileans | 79.0 /100 | #141 | Good 89.6% |
| Indians (Asian) | 78.8 /100 | #142 | Good 89.6% |
| Pakistanis | 78.3 /100 | #143 | Good 89.6% |
| Immigrants | Kenya | 78.0 /100 | #144 | Good 89.6% |
| Immigrants | Brazil | 76.6 /100 | #145 | Good 89.5% |
Demographics Similar to Croatians by High School Diploma
In terms of high school diploma, the demographic groups most similar to Croatians are Latvian (92.0%, a difference of 0.030%), Chinese (92.0%, a difference of 0.050%), Slovak (92.0%, a difference of 0.060%), Immigrants from India (92.0%, a difference of 0.060%), and Eastern European (91.9%, a difference of 0.070%).
| Demographics | Rating | Rank | High School Diploma |
| Carpatho Rusyns | 100.0 /100 | #3 | Exceptional 92.1% |
| Lithuanians | 100.0 /100 | #4 | Exceptional 92.0% |
| Slovenes | 100.0 /100 | #5 | Exceptional 92.0% |
| Slovaks | 100.0 /100 | #6 | Exceptional 92.0% |
| Immigrants | India | 100.0 /100 | #7 | Exceptional 92.0% |
| Chinese | 100.0 /100 | #8 | Exceptional 92.0% |
| Latvians | 100.0 /100 | #9 | Exceptional 92.0% |
| Croatians | 100.0 /100 | #10 | Exceptional 92.0% |
| Eastern Europeans | 100.0 /100 | #11 | Exceptional 91.9% |
| Poles | 100.0 /100 | #12 | Exceptional 91.9% |
| Danes | 100.0 /100 | #13 | Exceptional 91.8% |
| Bulgarians | 100.0 /100 | #14 | Exceptional 91.8% |
| Luxembourgers | 100.0 /100 | #15 | Exceptional 91.7% |
| Finns | 100.0 /100 | #16 | Exceptional 91.7% |
| Immigrants | Singapore | 99.9 /100 | #17 | Exceptional 91.7% |