Assyrian/Chaldean/Syriac vs Osage High School Diploma
COMPARE
Assyrian/Chaldean/Syriac
Osage
High School Diploma
High School Diploma Comparison
Assyrians/Chaldeans/Syriacs
Osage
89.7%
HIGH SCHOOL DIPLOMA
82.5/ 100
METRIC RATING
138th/ 347
METRIC RANK
89.1%
HIGH SCHOOL DIPLOMA
48.9/ 100
METRIC RATING
176th/ 347
METRIC RANK
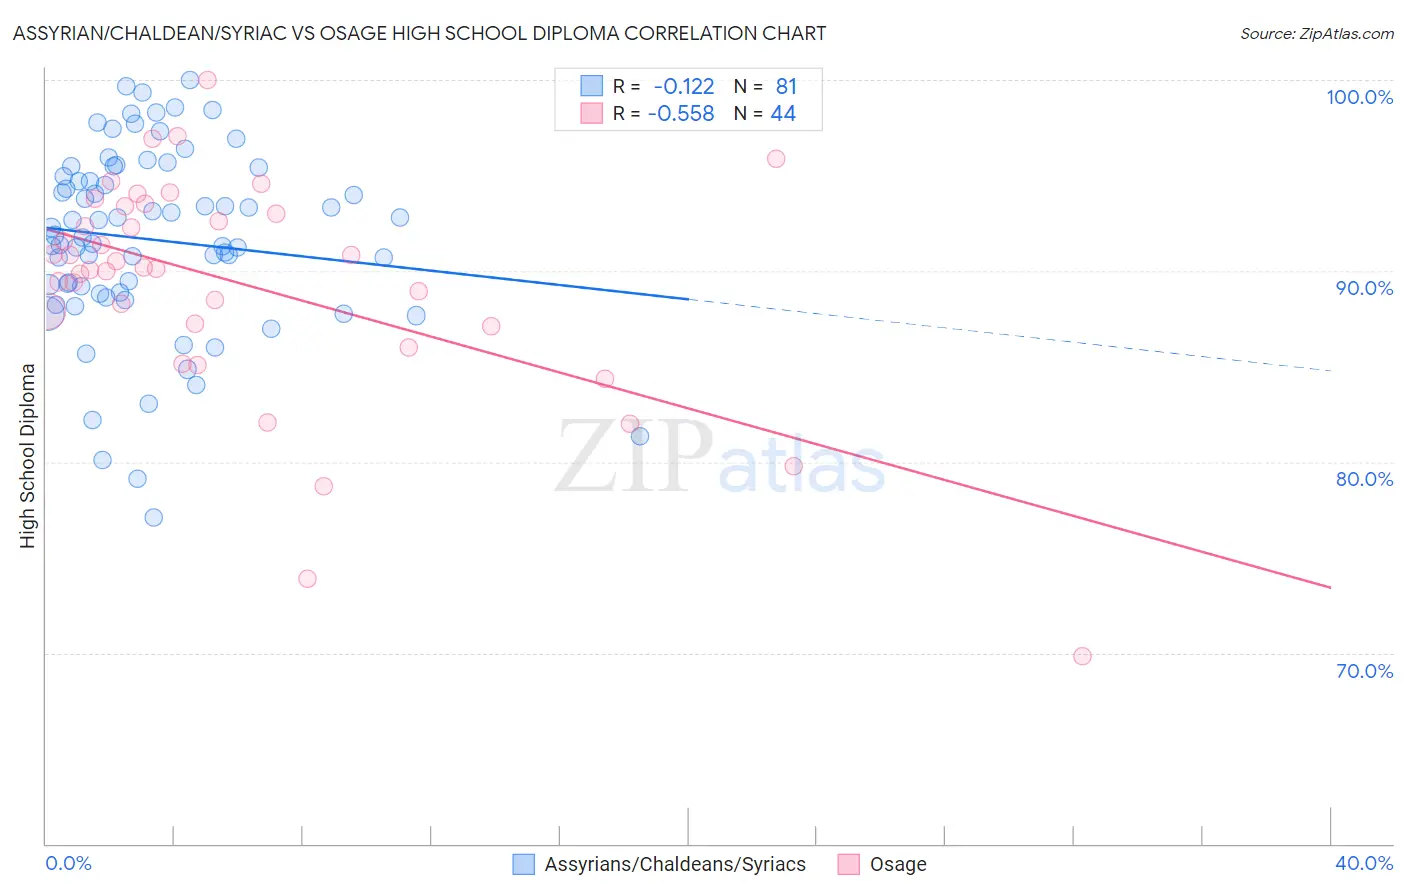
Assyrian/Chaldean/Syriac vs Osage High School Diploma Correlation Chart
The statistical analysis conducted on geographies consisting of 110,318,304 people shows a poor negative correlation between the proportion of Assyrians/Chaldeans/Syriacs and percentage of population with at least high school diploma education in the United States with a correlation coefficient (R) of -0.122 and weighted average of 89.7%. Similarly, the statistical analysis conducted on geographies consisting of 91,808,913 people shows a substantial negative correlation between the proportion of Osage and percentage of population with at least high school diploma education in the United States with a correlation coefficient (R) of -0.558 and weighted average of 89.1%, a difference of 0.60%.
High School Diploma Correlation Summary
| Measurement | Assyrian/Chaldean/Syriac | Osage |
| Minimum | 77.1% | 69.8% |
| Maximum | 100.0% | 100.0% |
| Range | 22.9% | 30.2% |
| Mean | 91.6% | 89.3% |
| Median | 91.9% | 90.1% |
| Interquartile 25% (IQ1) | 88.8% | 87.2% |
| Interquartile 75% (IQ3) | 95.2% | 93.2% |
| Interquartile Range (IQR) | 6.3% | 6.0% |
| Standard Deviation (Sample) | 4.9% | 5.9% |
| Standard Deviation (Population) | 4.8% | 5.8% |
Similar Demographics by High School Diploma
Demographics Similar to Assyrians/Chaldeans/Syriacs by High School Diploma
In terms of high school diploma, the demographic groups most similar to Assyrians/Chaldeans/Syriacs are Ugandan (89.7%, a difference of 0.030%), Arab (89.7%, a difference of 0.030%), Kenyan (89.6%, a difference of 0.030%), Immigrants from Egypt (89.6%, a difference of 0.030%), and Chilean (89.6%, a difference of 0.080%).
| Demographics | Rating | Rank | High School Diploma |
| Immigrants | Italy | 87.4 /100 | #131 | Excellent 89.8% |
| Immigrants | Bosnia and Herzegovina | 87.3 /100 | #132 | Excellent 89.8% |
| Albanians | 87.2 /100 | #133 | Excellent 89.8% |
| Immigrants | Jordan | 87.2 /100 | #134 | Excellent 89.8% |
| Chippewa | 85.6 /100 | #135 | Excellent 89.7% |
| Ugandans | 83.7 /100 | #136 | Excellent 89.7% |
| Arabs | 83.6 /100 | #137 | Excellent 89.7% |
| Assyrians/Chaldeans/Syriacs | 82.5 /100 | #138 | Excellent 89.7% |
| Kenyans | 81.4 /100 | #139 | Excellent 89.6% |
| Immigrants | Egypt | 81.2 /100 | #140 | Excellent 89.6% |
| Chileans | 79.0 /100 | #141 | Good 89.6% |
| Indians (Asian) | 78.8 /100 | #142 | Good 89.6% |
| Pakistanis | 78.3 /100 | #143 | Good 89.6% |
| Immigrants | Kenya | 78.0 /100 | #144 | Good 89.6% |
| Immigrants | Brazil | 76.6 /100 | #145 | Good 89.5% |
Demographics Similar to Osage by High School Diploma
In terms of high school diploma, the demographic groups most similar to Osage are Immigrants from Western Asia (89.1%, a difference of 0.0%), Sudanese (89.1%, a difference of 0.010%), Sierra Leonean (89.1%, a difference of 0.010%), Immigrants from Indonesia (89.1%, a difference of 0.020%), and Hmong (89.1%, a difference of 0.020%).
| Demographics | Rating | Rank | High School Diploma |
| Iroquois | 55.1 /100 | #169 | Average 89.2% |
| Immigrants | Morocco | 53.3 /100 | #170 | Average 89.2% |
| Spanish | 52.9 /100 | #171 | Average 89.2% |
| Immigrants | Nonimmigrants | 51.8 /100 | #172 | Average 89.2% |
| Immigrants | Indonesia | 50.3 /100 | #173 | Average 89.1% |
| Hmong | 50.0 /100 | #174 | Average 89.1% |
| Immigrants | Western Asia | 49.0 /100 | #175 | Average 89.1% |
| Osage | 48.9 /100 | #176 | Average 89.1% |
| Sudanese | 48.5 /100 | #177 | Average 89.1% |
| Sierra Leoneans | 48.4 /100 | #178 | Average 89.1% |
| Americans | 47.2 /100 | #179 | Average 89.1% |
| Bolivians | 45.2 /100 | #180 | Average 89.1% |
| Venezuelans | 43.6 /100 | #181 | Average 89.1% |
| Spaniards | 43.4 /100 | #182 | Average 89.1% |
| Potawatomi | 42.5 /100 | #183 | Average 89.0% |