Assyrian/Chaldean/Syriac vs Immigrants from Iran High School Diploma
COMPARE
Assyrian/Chaldean/Syriac
Immigrants from Iran
High School Diploma
High School Diploma Comparison
Assyrians/Chaldeans/Syriacs
Immigrants from Iran
89.7%
HIGH SCHOOL DIPLOMA
82.5/ 100
METRIC RATING
138th/ 347
METRIC RANK
90.9%
HIGH SCHOOL DIPLOMA
99.5/ 100
METRIC RATING
67th/ 347
METRIC RANK
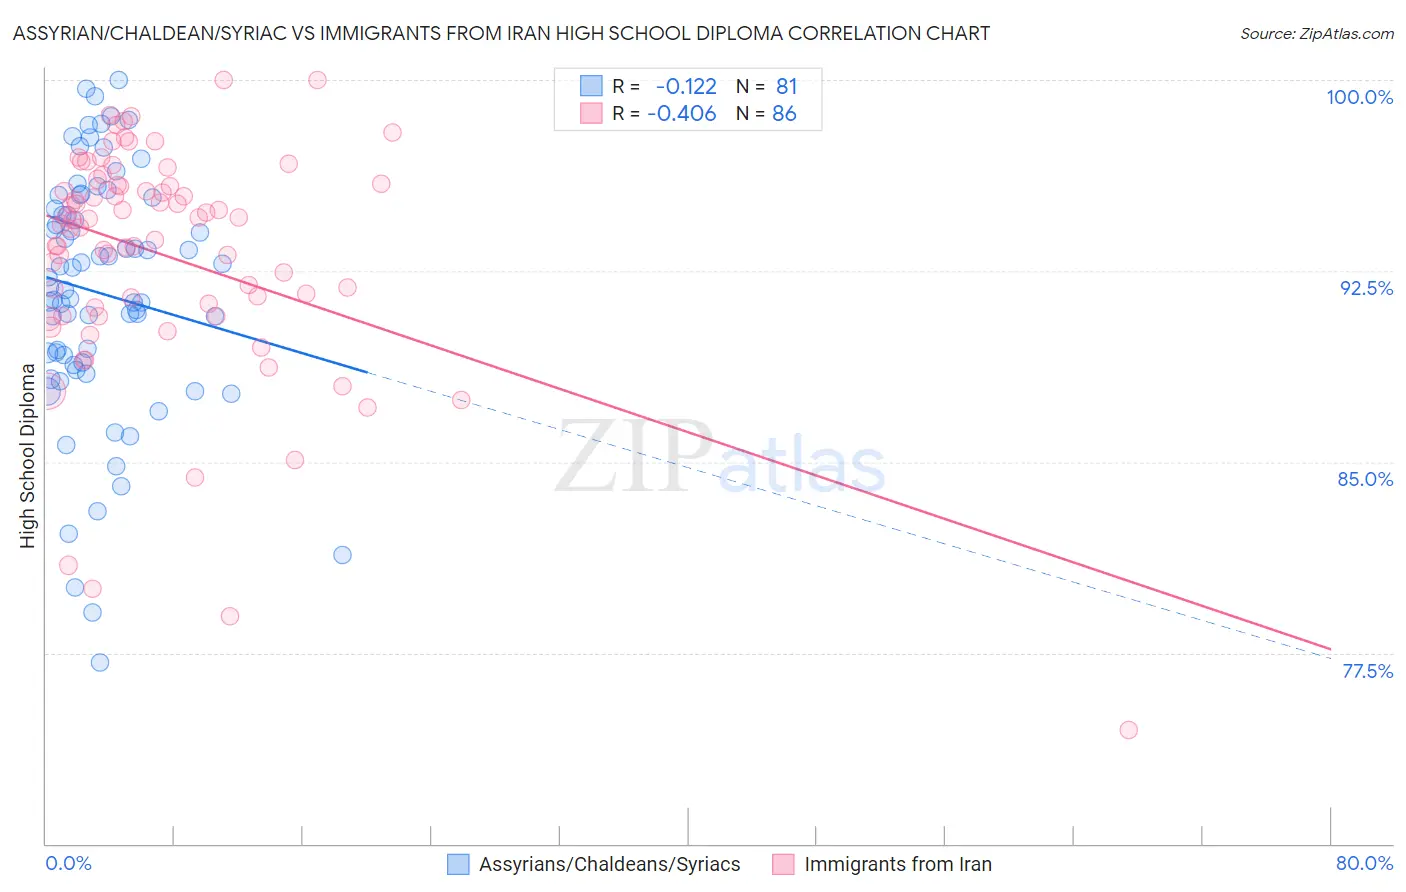
Assyrian/Chaldean/Syriac vs Immigrants from Iran High School Diploma Correlation Chart
The statistical analysis conducted on geographies consisting of 110,318,304 people shows a poor negative correlation between the proportion of Assyrians/Chaldeans/Syriacs and percentage of population with at least high school diploma education in the United States with a correlation coefficient (R) of -0.122 and weighted average of 89.7%. Similarly, the statistical analysis conducted on geographies consisting of 279,904,902 people shows a moderate negative correlation between the proportion of Immigrants from Iran and percentage of population with at least high school diploma education in the United States with a correlation coefficient (R) of -0.406 and weighted average of 90.9%, a difference of 1.4%.
High School Diploma Correlation Summary
| Measurement | Assyrian/Chaldean/Syriac | Immigrants from Iran |
| Minimum | 77.1% | 74.5% |
| Maximum | 100.0% | 100.0% |
| Range | 22.9% | 25.5% |
| Mean | 91.6% | 93.1% |
| Median | 91.9% | 94.4% |
| Interquartile 25% (IQ1) | 88.8% | 91.1% |
| Interquartile 75% (IQ3) | 95.2% | 95.9% |
| Interquartile Range (IQR) | 6.3% | 4.8% |
| Standard Deviation (Sample) | 4.9% | 4.6% |
| Standard Deviation (Population) | 4.8% | 4.6% |
Similar Demographics by High School Diploma
Demographics Similar to Assyrians/Chaldeans/Syriacs by High School Diploma
In terms of high school diploma, the demographic groups most similar to Assyrians/Chaldeans/Syriacs are Ugandan (89.7%, a difference of 0.030%), Arab (89.7%, a difference of 0.030%), Kenyan (89.6%, a difference of 0.030%), Immigrants from Egypt (89.6%, a difference of 0.030%), and Chilean (89.6%, a difference of 0.080%).
| Demographics | Rating | Rank | High School Diploma |
| Immigrants | Italy | 87.4 /100 | #131 | Excellent 89.8% |
| Immigrants | Bosnia and Herzegovina | 87.3 /100 | #132 | Excellent 89.8% |
| Albanians | 87.2 /100 | #133 | Excellent 89.8% |
| Immigrants | Jordan | 87.2 /100 | #134 | Excellent 89.8% |
| Chippewa | 85.6 /100 | #135 | Excellent 89.7% |
| Ugandans | 83.7 /100 | #136 | Excellent 89.7% |
| Arabs | 83.6 /100 | #137 | Excellent 89.7% |
| Assyrians/Chaldeans/Syriacs | 82.5 /100 | #138 | Excellent 89.7% |
| Kenyans | 81.4 /100 | #139 | Excellent 89.6% |
| Immigrants | Egypt | 81.2 /100 | #140 | Excellent 89.6% |
| Chileans | 79.0 /100 | #141 | Good 89.6% |
| Indians (Asian) | 78.8 /100 | #142 | Good 89.6% |
| Pakistanis | 78.3 /100 | #143 | Good 89.6% |
| Immigrants | Kenya | 78.0 /100 | #144 | Good 89.6% |
| Immigrants | Brazil | 76.6 /100 | #145 | Good 89.5% |
Demographics Similar to Immigrants from Iran by High School Diploma
In terms of high school diploma, the demographic groups most similar to Immigrants from Iran are Czechoslovakian (90.9%, a difference of 0.010%), French (91.0%, a difference of 0.020%), Ukrainian (91.0%, a difference of 0.030%), Immigrants from South Africa (91.0%, a difference of 0.030%), and Immigrants from Netherlands (91.0%, a difference of 0.040%).
| Demographics | Rating | Rank | High School Diploma |
| Immigrants | Japan | 99.6 /100 | #60 | Exceptional 91.0% |
| Immigrants | Taiwan | 99.6 /100 | #61 | Exceptional 91.0% |
| Austrians | 99.6 /100 | #62 | Exceptional 91.0% |
| Immigrants | Netherlands | 99.6 /100 | #63 | Exceptional 91.0% |
| Ukrainians | 99.6 /100 | #64 | Exceptional 91.0% |
| Immigrants | South Africa | 99.6 /100 | #65 | Exceptional 91.0% |
| French | 99.5 /100 | #66 | Exceptional 91.0% |
| Immigrants | Iran | 99.5 /100 | #67 | Exceptional 90.9% |
| Czechoslovakians | 99.5 /100 | #68 | Exceptional 90.9% |
| French Canadians | 99.5 /100 | #69 | Exceptional 90.9% |
| Immigrants | Latvia | 99.5 /100 | #70 | Exceptional 90.9% |
| Alaskan Athabascans | 99.4 /100 | #71 | Exceptional 90.9% |
| Soviet Union | 99.4 /100 | #72 | Exceptional 90.9% |
| Immigrants | South Central Asia | 99.4 /100 | #73 | Exceptional 90.9% |
| Immigrants | Czechoslovakia | 99.4 /100 | #74 | Exceptional 90.9% |