Asian vs Immigrants from Guatemala GED/Equivalency
COMPARE
Asian
Immigrants from Guatemala
GED/Equivalency
GED/Equivalency Comparison
Asians
Immigrants from Guatemala
86.7%
GED/EQUIVALENCY
90.3/ 100
METRIC RATING
126th/ 347
METRIC RANK
77.9%
GED/EQUIVALENCY
0.0/ 100
METRIC RATING
338th/ 347
METRIC RANK
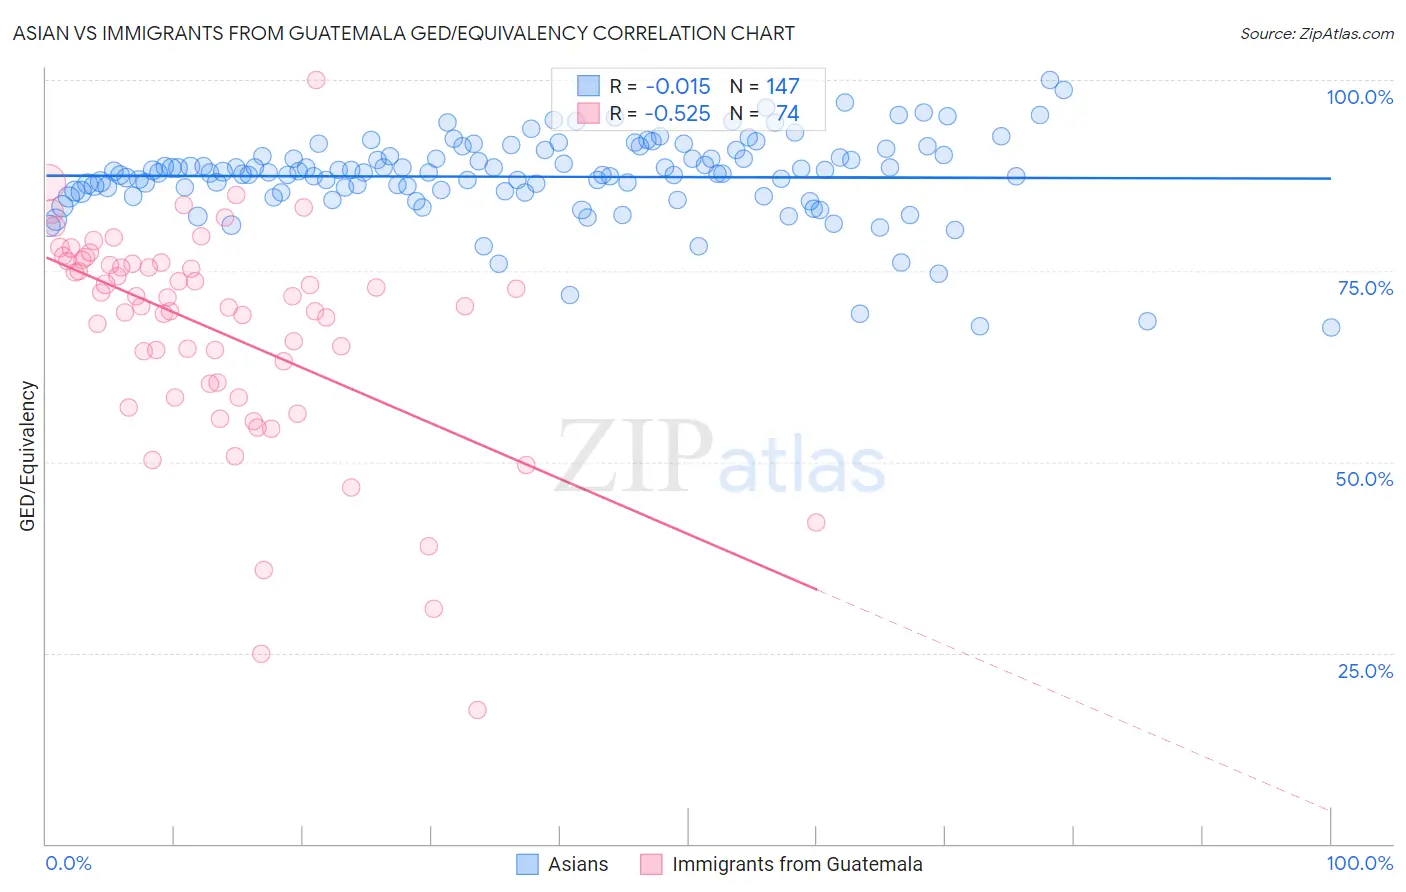
Asian vs Immigrants from Guatemala GED/Equivalency Correlation Chart
The statistical analysis conducted on geographies consisting of 550,857,886 people shows no correlation between the proportion of Asians and percentage of population with at least ged/equivalency education in the United States with a correlation coefficient (R) of -0.015 and weighted average of 86.7%. Similarly, the statistical analysis conducted on geographies consisting of 377,286,142 people shows a substantial negative correlation between the proportion of Immigrants from Guatemala and percentage of population with at least ged/equivalency education in the United States with a correlation coefficient (R) of -0.525 and weighted average of 77.9%, a difference of 11.3%.
GED/Equivalency Correlation Summary
| Measurement | Asian | Immigrants from Guatemala |
| Minimum | 67.7% | 17.4% |
| Maximum | 100.0% | 100.0% |
| Range | 32.3% | 82.6% |
| Mean | 87.3% | 67.2% |
| Median | 87.9% | 71.0% |
| Interquartile 25% (IQ1) | 85.4% | 60.2% |
| Interquartile 75% (IQ3) | 90.1% | 76.1% |
| Interquartile Range (IQR) | 4.8% | 15.9% |
| Standard Deviation (Sample) | 5.5% | 14.6% |
| Standard Deviation (Population) | 5.5% | 14.5% |
Similar Demographics by GED/Equivalency
Demographics Similar to Asians by GED/Equivalency
In terms of ged/equivalency, the demographic groups most similar to Asians are Immigrants from Egypt (86.7%, a difference of 0.010%), Celtic (86.7%, a difference of 0.010%), Immigrants from Italy (86.7%, a difference of 0.020%), Immigrants from Jordan (86.8%, a difference of 0.030%), and Argentinean (86.7%, a difference of 0.030%).
| Demographics | Rating | Rank | GED/Equivalency |
| Immigrants | China | 93.2 /100 | #119 | Exceptional 86.9% |
| Scotch-Irish | 91.6 /100 | #120 | Exceptional 86.8% |
| Immigrants | Lebanon | 90.9 /100 | #121 | Exceptional 86.8% |
| Immigrants | Jordan | 90.8 /100 | #122 | Exceptional 86.8% |
| Immigrants | Italy | 90.5 /100 | #123 | Exceptional 86.7% |
| Immigrants | Egypt | 90.4 /100 | #124 | Exceptional 86.7% |
| Celtics | 90.4 /100 | #125 | Exceptional 86.7% |
| Asians | 90.3 /100 | #126 | Exceptional 86.7% |
| Argentineans | 89.7 /100 | #127 | Excellent 86.7% |
| Yugoslavians | 89.5 /100 | #128 | Excellent 86.7% |
| Immigrants | Ukraine | 88.9 /100 | #129 | Excellent 86.7% |
| Immigrants | Germany | 88.8 /100 | #130 | Excellent 86.7% |
| Immigrants | Spain | 88.5 /100 | #131 | Excellent 86.7% |
| Immigrants | Brazil | 88.4 /100 | #132 | Excellent 86.6% |
| Tsimshian | 88.3 /100 | #133 | Excellent 86.6% |
Demographics Similar to Immigrants from Guatemala by GED/Equivalency
In terms of ged/equivalency, the demographic groups most similar to Immigrants from Guatemala are Immigrants from Yemen (77.9%, a difference of 0.020%), Immigrants from Dominican Republic (78.0%, a difference of 0.090%), Immigrants from El Salvador (77.6%, a difference of 0.38%), Tohono O'odham (77.5%, a difference of 0.54%), and Mexican (77.4%, a difference of 0.63%).
| Demographics | Rating | Rank | GED/Equivalency |
| Immigrants | Honduras | 0.0 /100 | #331 | Tragic 78.7% |
| Immigrants | Azores | 0.0 /100 | #332 | Tragic 78.7% |
| Salvadorans | 0.0 /100 | #333 | Tragic 78.6% |
| Guatemalans | 0.0 /100 | #334 | Tragic 78.5% |
| Immigrants | Latin America | 0.0 /100 | #335 | Tragic 78.5% |
| Immigrants | Dominican Republic | 0.0 /100 | #336 | Tragic 78.0% |
| Immigrants | Yemen | 0.0 /100 | #337 | Tragic 77.9% |
| Immigrants | Guatemala | 0.0 /100 | #338 | Tragic 77.9% |
| Immigrants | El Salvador | 0.0 /100 | #339 | Tragic 77.6% |
| Tohono O'odham | 0.0 /100 | #340 | Tragic 77.5% |
| Mexicans | 0.0 /100 | #341 | Tragic 77.4% |
| Pima | 0.0 /100 | #342 | Tragic 76.4% |
| Immigrants | Central America | 0.0 /100 | #343 | Tragic 76.4% |
| Spanish American Indians | 0.0 /100 | #344 | Tragic 76.3% |
| Immigrants | Mexico | 0.0 /100 | #345 | Tragic 75.7% |