Immigrants from Fiji vs Immigrants from Moldova Master's Degree
COMPARE
Immigrants from Fiji
Immigrants from Moldova
Master's Degree
Master's Degree Comparison
Immigrants from Fiji
Immigrants from Moldova
12.4%
MASTER'S DEGREE
0.5/ 100
METRIC RATING
265th/ 347
METRIC RANK
16.6%
MASTER'S DEGREE
97.2/ 100
METRIC RATING
117th/ 347
METRIC RANK
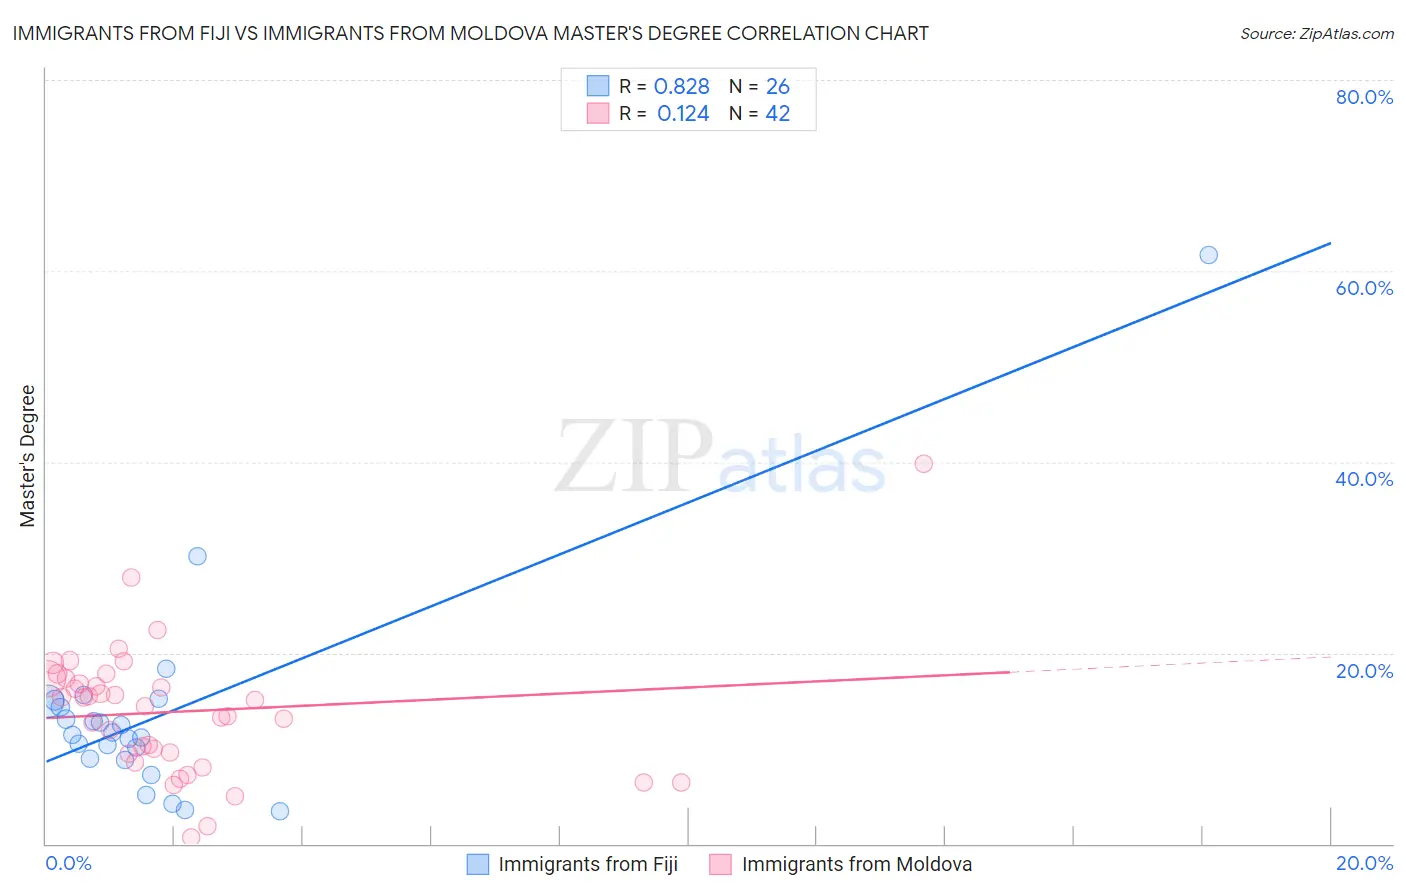
Immigrants from Fiji vs Immigrants from Moldova Master's Degree Correlation Chart
The statistical analysis conducted on geographies consisting of 93,754,667 people shows a very strong positive correlation between the proportion of Immigrants from Fiji and percentage of population with at least master's degree education in the United States with a correlation coefficient (R) of 0.828 and weighted average of 12.4%. Similarly, the statistical analysis conducted on geographies consisting of 124,394,558 people shows a poor positive correlation between the proportion of Immigrants from Moldova and percentage of population with at least master's degree education in the United States with a correlation coefficient (R) of 0.124 and weighted average of 16.6%, a difference of 33.9%.
Master's Degree Correlation Summary
| Measurement | Immigrants from Fiji | Immigrants from Moldova |
| Minimum | 3.5% | 0.61% |
| Maximum | 61.7% | 39.8% |
| Range | 58.2% | 39.2% |
| Mean | 13.6% | 13.8% |
| Median | 11.5% | 14.7% |
| Interquartile 25% (IQ1) | 8.9% | 9.4% |
| Interquartile 75% (IQ3) | 14.9% | 17.2% |
| Interquartile Range (IQR) | 6.0% | 7.9% |
| Standard Deviation (Sample) | 11.2% | 7.0% |
| Standard Deviation (Population) | 11.0% | 6.9% |
Similar Demographics by Master's Degree
Demographics Similar to Immigrants from Fiji by Master's Degree
In terms of master's degree, the demographic groups most similar to Immigrants from Fiji are Belizean (12.4%, a difference of 0.020%), Bahamian (12.4%, a difference of 0.16%), Central American Indian (12.4%, a difference of 0.19%), Nicaraguan (12.5%, a difference of 0.42%), and Tongan (12.5%, a difference of 0.61%).
| Demographics | Rating | Rank | Master's Degree |
| Immigrants | Liberia | 0.6 /100 | #258 | Tragic 12.5% |
| Japanese | 0.6 /100 | #259 | Tragic 12.5% |
| Dominicans | 0.6 /100 | #260 | Tragic 12.5% |
| Tongans | 0.6 /100 | #261 | Tragic 12.5% |
| Nicaraguans | 0.6 /100 | #262 | Tragic 12.5% |
| Central American Indians | 0.5 /100 | #263 | Tragic 12.4% |
| Belizeans | 0.5 /100 | #264 | Tragic 12.4% |
| Immigrants | Fiji | 0.5 /100 | #265 | Tragic 12.4% |
| Bahamians | 0.5 /100 | #266 | Tragic 12.4% |
| Americans | 0.4 /100 | #267 | Tragic 12.3% |
| Native Hawaiians | 0.4 /100 | #268 | Tragic 12.3% |
| Central Americans | 0.3 /100 | #269 | Tragic 12.2% |
| Salvadorans | 0.3 /100 | #270 | Tragic 12.2% |
| Haitians | 0.3 /100 | #271 | Tragic 12.1% |
| Comanche | 0.3 /100 | #272 | Tragic 12.1% |
Demographics Similar to Immigrants from Moldova by Master's Degree
In terms of master's degree, the demographic groups most similar to Immigrants from Moldova are Immigrants from Southern Europe (16.6%, a difference of 0.010%), Immigrants from Uganda (16.6%, a difference of 0.13%), Brazilian (16.5%, a difference of 0.42%), Northern European (16.7%, a difference of 0.43%), and Arab (16.7%, a difference of 0.50%).
| Demographics | Rating | Rank | Master's Degree |
| Immigrants | Chile | 98.0 /100 | #110 | Exceptional 16.8% |
| Austrians | 97.8 /100 | #111 | Exceptional 16.7% |
| Macedonians | 97.7 /100 | #112 | Exceptional 16.7% |
| Arabs | 97.7 /100 | #113 | Exceptional 16.7% |
| Northern Europeans | 97.6 /100 | #114 | Exceptional 16.7% |
| Immigrants | Uganda | 97.3 /100 | #115 | Exceptional 16.6% |
| Immigrants | Southern Europe | 97.2 /100 | #116 | Exceptional 16.6% |
| Immigrants | Moldova | 97.2 /100 | #117 | Exceptional 16.6% |
| Brazilians | 96.8 /100 | #118 | Exceptional 16.5% |
| Jordanians | 96.5 /100 | #119 | Exceptional 16.5% |
| Lebanese | 96.4 /100 | #120 | Exceptional 16.5% |
| Afghans | 96.2 /100 | #121 | Exceptional 16.5% |
| British | 95.6 /100 | #122 | Exceptional 16.4% |
| Croatians | 95.6 /100 | #123 | Exceptional 16.4% |
| Immigrants | Eritrea | 95.5 /100 | #124 | Exceptional 16.4% |