Asian vs Immigrants from Moldova Single Father Households
COMPARE
Asian
Immigrants from Moldova
Single Father Households
Single Father Households Comparison
Asians
Immigrants from Moldova
2.1%
SINGLE FATHER HOUSEHOLDS
99.6/ 100
METRIC RATING
86th/ 347
METRIC RANK
2.1%
SINGLE FATHER HOUSEHOLDS
99.1/ 100
METRIC RATING
97th/ 347
METRIC RANK
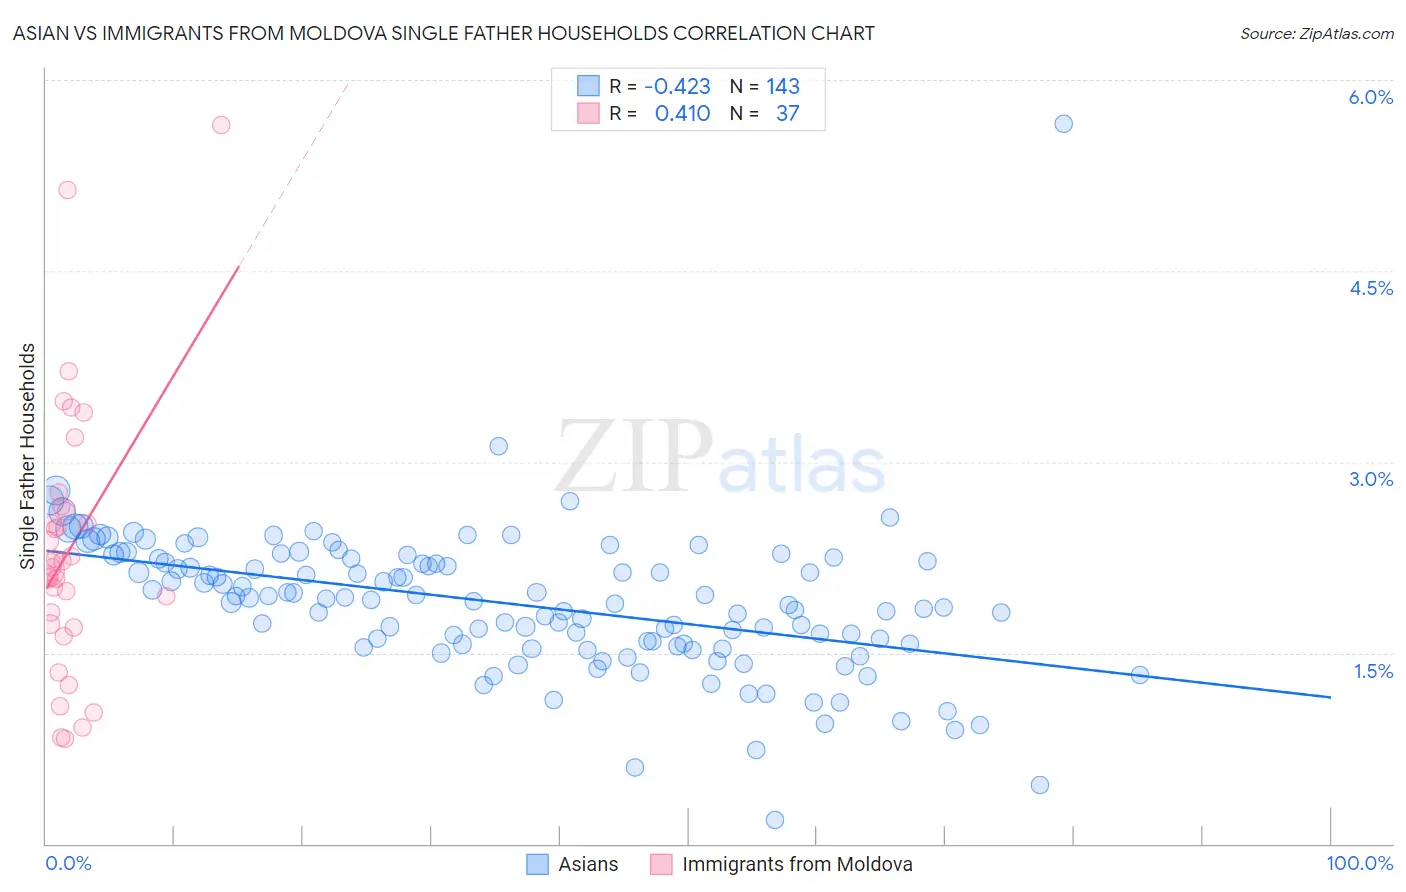
Asian vs Immigrants from Moldova Single Father Households Correlation Chart
The statistical analysis conducted on geographies consisting of 539,811,945 people shows a moderate negative correlation between the proportion of Asians and percentage of single father households in the United States with a correlation coefficient (R) of -0.423 and weighted average of 2.1%. Similarly, the statistical analysis conducted on geographies consisting of 124,176,344 people shows a moderate positive correlation between the proportion of Immigrants from Moldova and percentage of single father households in the United States with a correlation coefficient (R) of 0.410 and weighted average of 2.1%, a difference of 1.7%.
Single Father Households Correlation Summary
| Measurement | Asian | Immigrants from Moldova |
| Minimum | 0.19% | 0.82% |
| Maximum | 5.7% | 5.6% |
| Range | 5.5% | 4.8% |
| Mean | 1.9% | 2.3% |
| Median | 1.9% | 2.2% |
| Interquartile 25% (IQ1) | 1.6% | 1.7% |
| Interquartile 75% (IQ3) | 2.2% | 2.6% |
| Interquartile Range (IQR) | 0.67% | 0.92% |
| Standard Deviation (Sample) | 0.58% | 1.0% |
| Standard Deviation (Population) | 0.58% | 1.0% |
Demographics Similar to Asians and Immigrants from Moldova by Single Father Households
In terms of single father households, the demographic groups most similar to Asians are Immigrants from Hungary (2.1%, a difference of 0.080%), Carpatho Rusyn (2.1%, a difference of 0.12%), Greek (2.1%, a difference of 0.42%), New Zealander (2.1%, a difference of 0.43%), and Armenian (2.1%, a difference of 0.48%). Similarly, the demographic groups most similar to Immigrants from Moldova are Arab (2.1%, a difference of 0.13%), Guyanese (2.1%, a difference of 0.13%), South African (2.1%, a difference of 0.17%), Bermudan (2.1%, a difference of 0.27%), and Immigrants from Northern Africa (2.1%, a difference of 0.32%).
| Demographics | Rating | Rank | Single Father Households |
| Armenians | 99.7 /100 | #81 | Exceptional 2.1% |
| New Zealanders | 99.7 /100 | #82 | Exceptional 2.1% |
| Greeks | 99.7 /100 | #83 | Exceptional 2.1% |
| Carpatho Rusyns | 99.6 /100 | #84 | Exceptional 2.1% |
| Immigrants | Hungary | 99.6 /100 | #85 | Exceptional 2.1% |
| Asians | 99.6 /100 | #86 | Exceptional 2.1% |
| Lithuanians | 99.5 /100 | #87 | Exceptional 2.1% |
| Bhutanese | 99.5 /100 | #88 | Exceptional 2.1% |
| Immigrants | Armenia | 99.5 /100 | #89 | Exceptional 2.1% |
| Immigrants | Pakistan | 99.5 /100 | #90 | Exceptional 2.1% |
| Immigrants | Guyana | 99.4 /100 | #91 | Exceptional 2.1% |
| Romanians | 99.4 /100 | #92 | Exceptional 2.1% |
| Croatians | 99.3 /100 | #93 | Exceptional 2.1% |
| Ukrainians | 99.3 /100 | #94 | Exceptional 2.1% |
| Bermudans | 99.2 /100 | #95 | Exceptional 2.1% |
| Arabs | 99.2 /100 | #96 | Exceptional 2.1% |
| Immigrants | Moldova | 99.1 /100 | #97 | Exceptional 2.1% |
| Guyanese | 99.1 /100 | #98 | Exceptional 2.1% |
| South Africans | 99.1 /100 | #99 | Exceptional 2.1% |
| Immigrants | Northern Africa | 99.0 /100 | #100 | Exceptional 2.1% |
| Immigrants | Western Europe | 98.9 /100 | #101 | Exceptional 2.1% |